|
|
 |
|

|
|
|
Reconstruction of surface temperature data and analysis of spatial and temporal changes in North America |
MAO Kebiao1,2( ), YAN Yibo1, CAO Mengmeng1, YUAN Zijin2, QIN Zhihao1 ), YAN Yibo1, CAO Mengmeng1, YUAN Zijin2, QIN Zhihao1 |
1. Institute of Agricultural Resources and Regional Planning, Chinese Academy of Agricultural Sciences, Beijing 100081, China
2. School of Physics and Electronic-Engineering, Ningxia University, Yinchuan 750021, China |
|
|
|
|
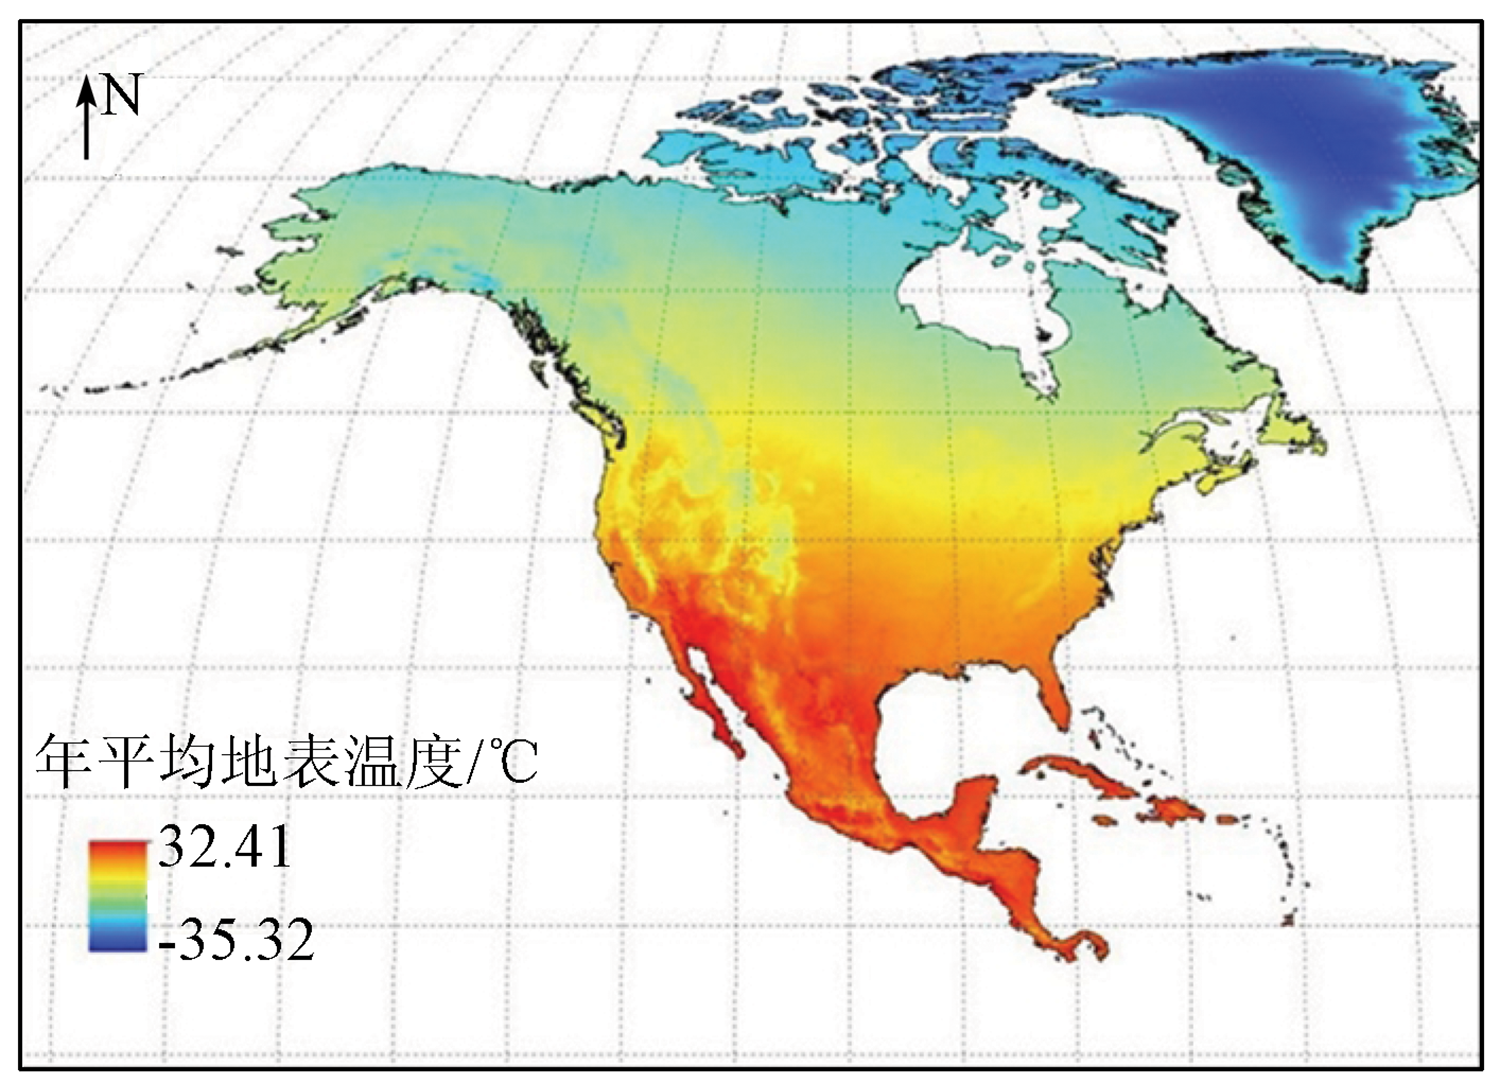
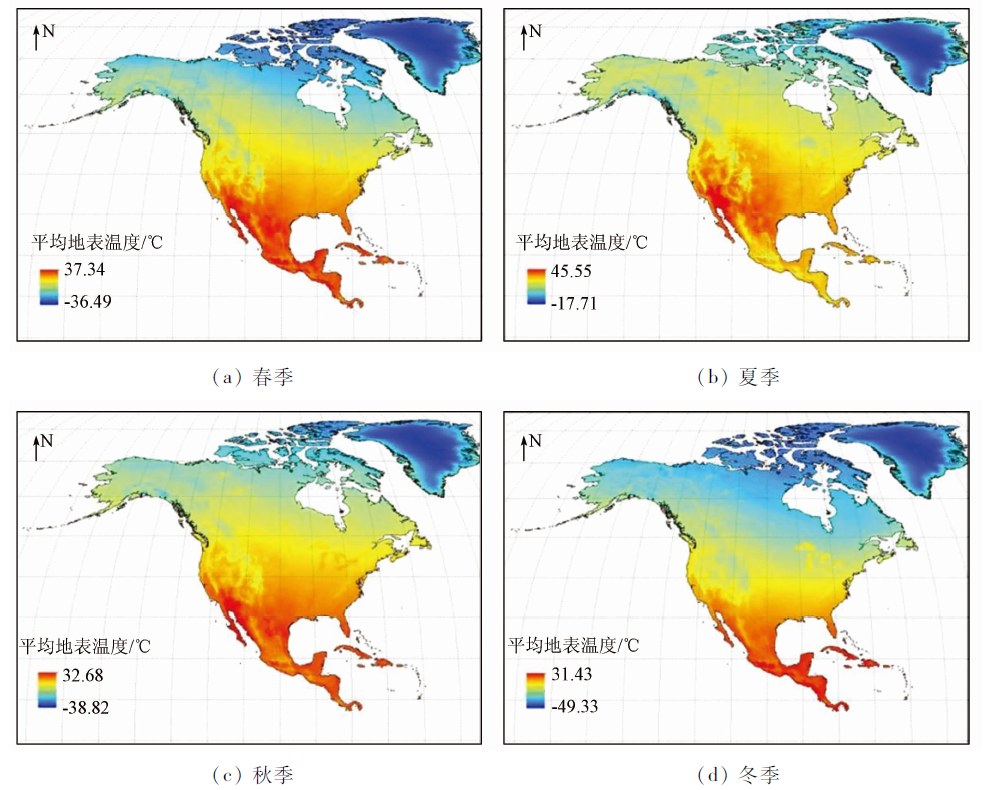
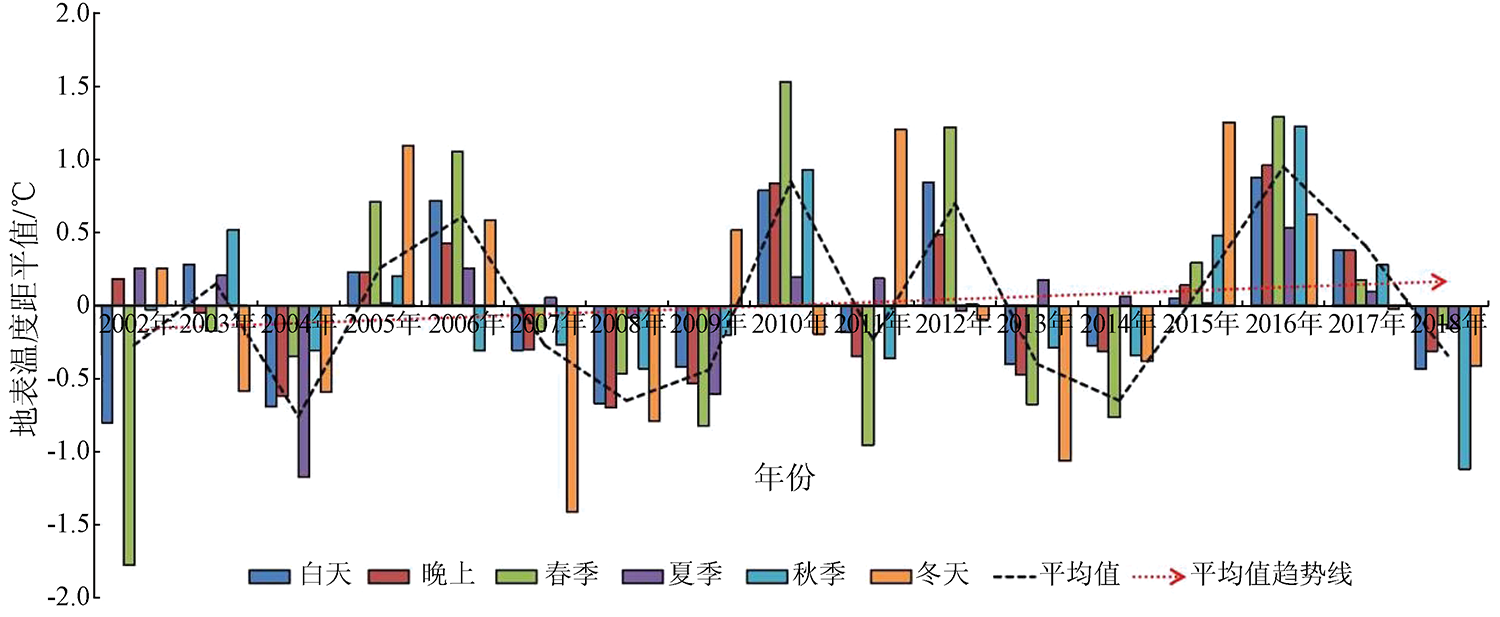
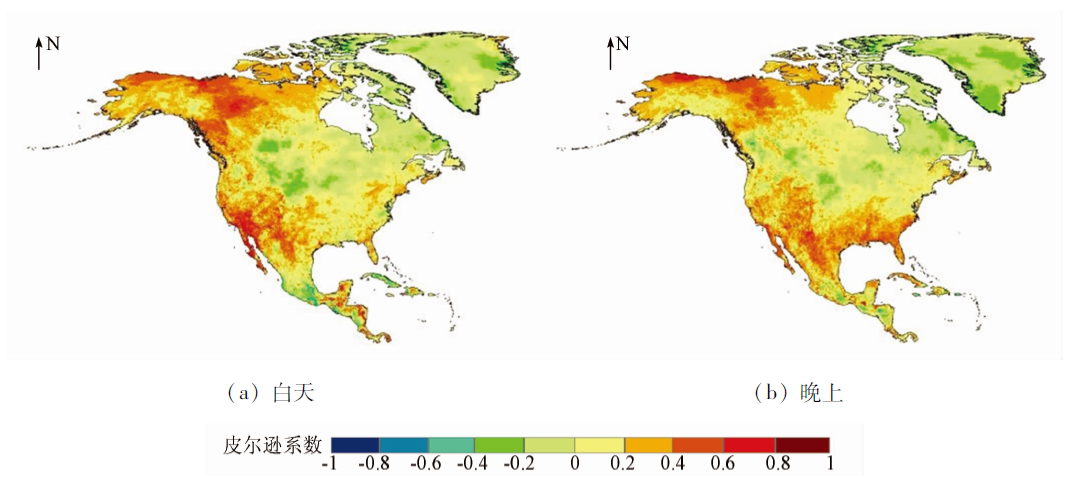
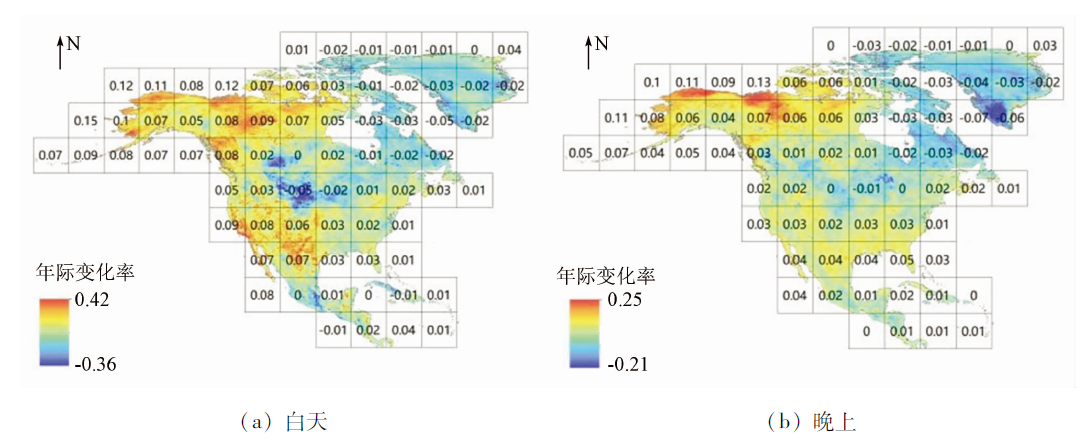
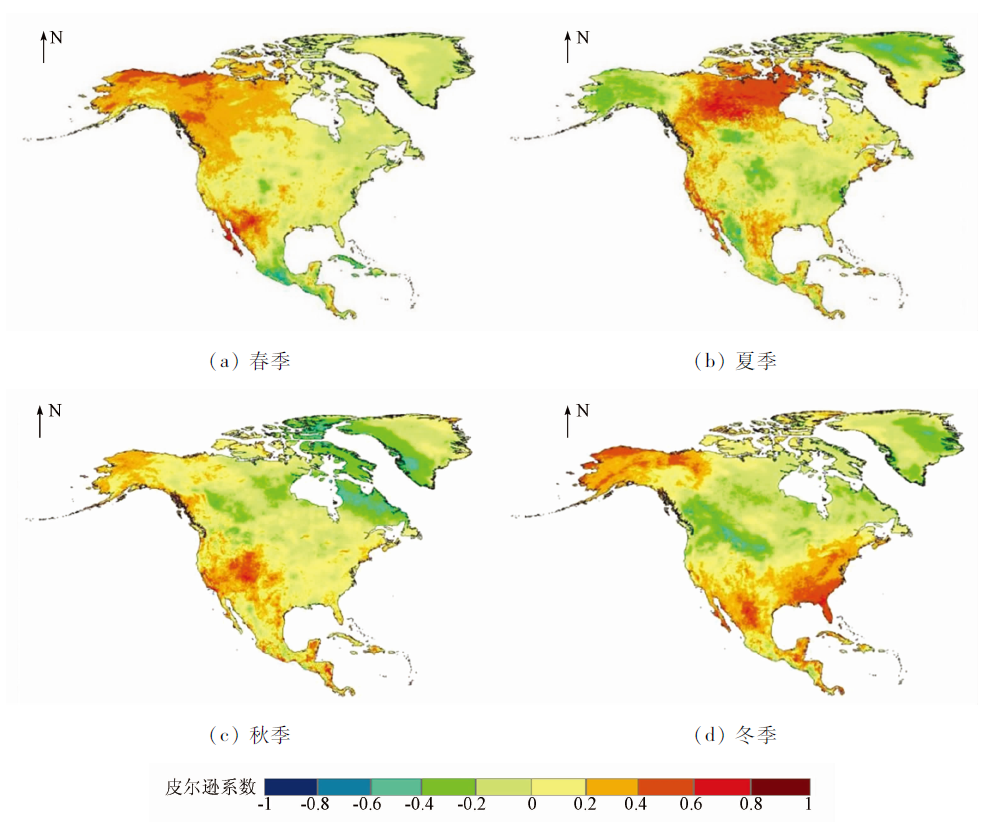
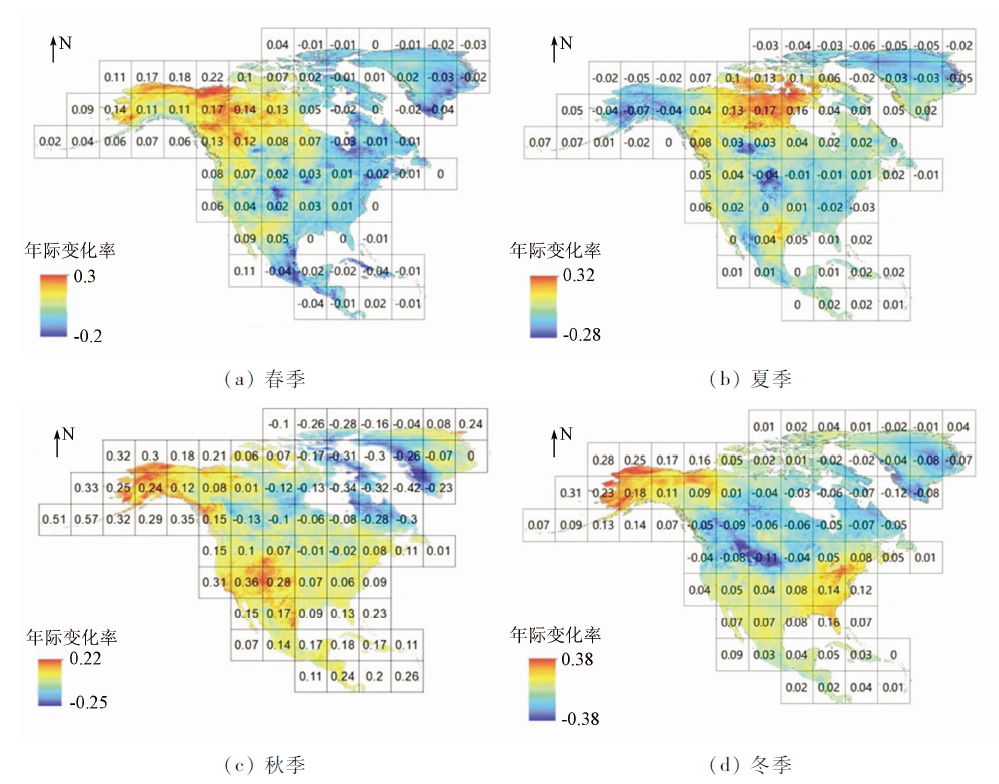
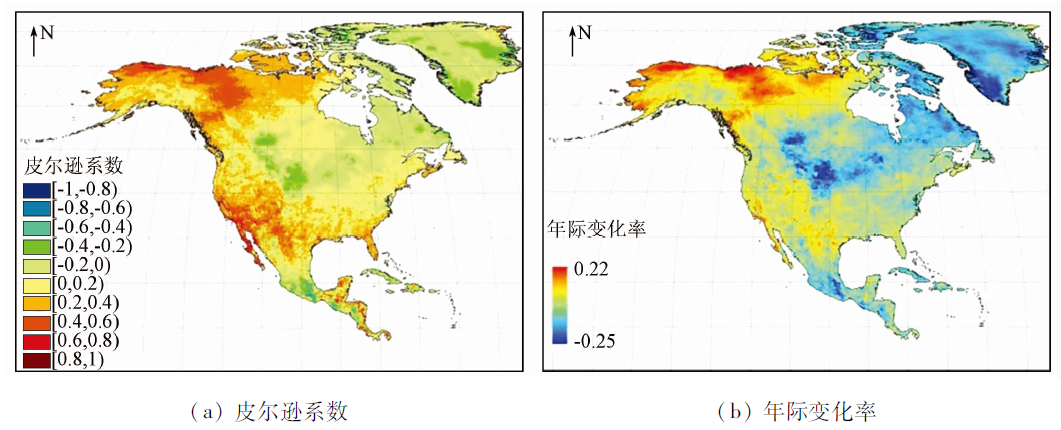
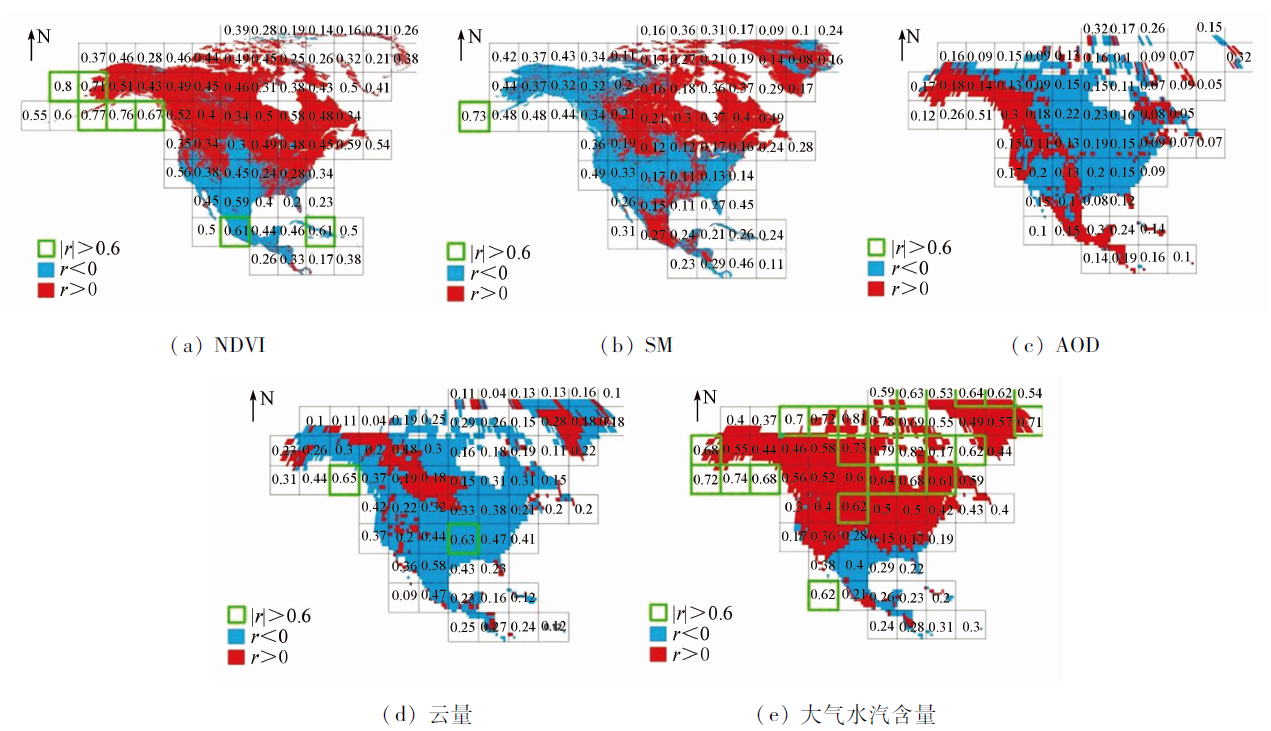
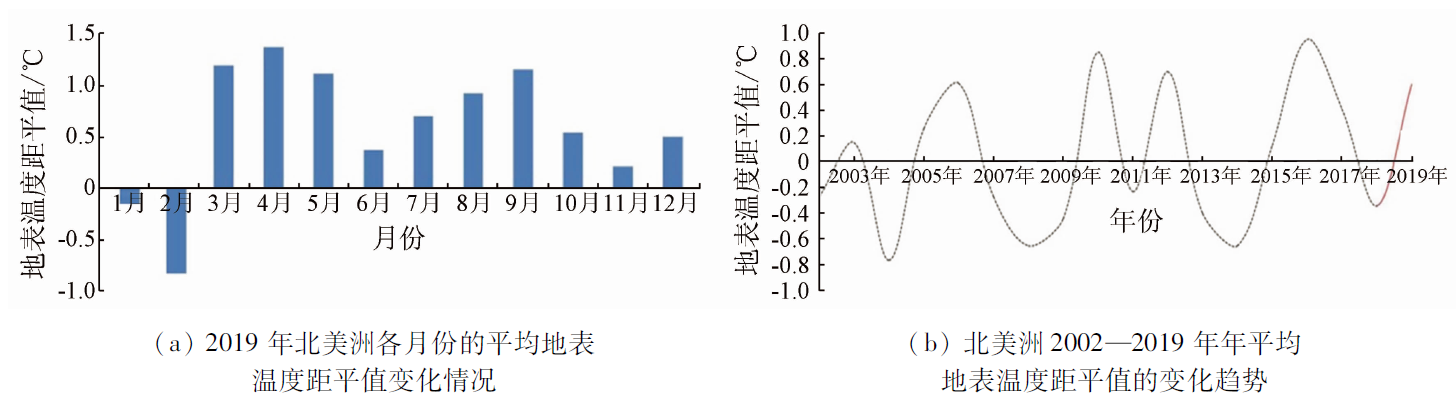
Abstract Surface temperature is an important indicator that reflects the regional natural environment and climate changes. High-quality data are very valuable for the study of the temporal and spatial changes in regional surface temperature. In recent years, North America has witnessed relatively abnormal climate changes, thus the surface temperature in this region has great study significance. Based on the MODIS surface temperature data, this study reconstructed the remotely sensed surface temperature data set of North America from 2002 to 2018 and analyzed the spatial and temporal changes in surface temperature over the past 17 years. The reconstructed surface temperature data cover all land surfaces of North America and guarantee precision of about 1 ℃. The analysis results are as follows. North America had a fluctuating temperature increase at an average rate of 0.02 ℃/a in the past 17 years. A historical peak in surface temperature increase occurred in 2016, followed by a sharp drop in the following two years, which was closely related to El Nino. In North America, the temperature increase was greater in spring and autumn than in winter and summer. In recent years, northern Alaska and the Baja California peninsula have experienced significant warming. Vegetation and atmospheric water vapor significantly affect the change in surface temperature. Vegetation and atmospheric water vapor are positively correlated with surface temperature in the north of 40°N, while they are negatively correlated in the south of 40°N. The general changing trend of surface temperature in the next 1~2 years can be predicted to a certain degree of reliability according to the periodic fluctuation trend of the average surface temperature in North America and the influence of El Nino.
|
| Keywords
data reconstruction
surface temperature
MODIS
temporal and spatial changes
|
|
|
|
Issue Date: 27 December 2022
|
|
|
| [1] |
Anderson M C, Norman J M, Kustas W P, et al. A thermal-based remote sensing technique for routine mapping of land-surface carbon,water and energy fluxes from field to regional scales[J]. Remote Sensing of Environment, 2008, 112:4227-4241.
doi: 10.1016/j.rse.2008.07.009
url: https://linkinghub.elsevier.com/retrieve/pii/S0034425708002289
|
| [2] |
唐国利, 任国玉. 近百年中国地表气温变化趋势的再分析[J]. 气候与环境研究, 2005(4):791-798.
|
| [2] |
Tang G L, Ren G Y. Reanalysis of surface air temperature change of the last 100 years over China[J]. Climatic and Environmental Research, 2005(4):791-798.
|
| [3] |
Brunsell N A, Gillies R R. Length scale analysis of surface energy fluxes derived from remote sensing[J]. Journal of Hydrometeorology, 2003, 4(6):1212-1219.
doi: 10.1175/1525-7541(2003)004<1212:LSAOSE>2.0.CO;2
url: http://journals.ametsoc.org/doi/10.1175/1525-7541(2003)004<1212:LSAOSE>2.0.CO;2
|
| [4] |
毛克彪, 左志远, 朱高峰, 等. 全球气候和生态系统变化与星体轨道位置变化关系研究[J]. 高技术通讯, 2016, 26(11):890-899.
|
| [4] |
Mao K B, Zuo Z Y, Zhu G F, et al. Study of the relationship between global climate-ecosystem’s change and planetary orbit position’s change[J]. High Technology Letters, 2016, 26(11):890-899.
|
| [5] |
王建凯, 王开存, 王普才. 基于MODIS地表温度产品的北京城市热岛(冷岛)强度分析[J]. 遥感学报, 2007(3):330-339.
|
| [5] |
Wang J K, Wang K C, Wang P C. Urban heat (or cool) island over Beijing from MODIS land surface temperature[J]. Journal of Remote Sensing, 2007(3):330-339.
|
| [6] |
Guo J, Mao K, Zhao Y, et al. Impact of climate on food security in Mainland China:A new perspective based on characteristics of major agricultural natural disasters and grain loss[J]. Sustainability, 2019, 869(11):1-25.
|
| [7] |
Hall D K, Williams R S, Luthcke S B, et al. Greenland ice sheet surface temperature,melt and mass loss:2000—06[J]. Journal of Glaciology, 2008, 54(184):81-93.
doi: 10.3189/002214308784409170
url: https://www.cambridge.org/core/product/identifier/S0022143000209878/type/journal_article
|
| [8] |
Xia L, Zhao F, Mao K, et al. SPI-based analyses of drought changes over the past 60 years in China’s major crop-growing areas[J]. Remote Sensing, 2018, 171(10):1-15.
|
| [9] |
Westerling A L. Warming and earlier spring increase western U.S.forest wildfire activity[J]. Science, 2006, 313(5789):940-943.
doi: 10.1126/science.1128834
pmid: 16825536
|
| [10] |
Ouzounov D, Freund F T. Mid-infrared emission prior to strong earthquakes analyzed by remote sensing data[J]. Advances in Space Research, 2004, 33(3):268-273.
doi: 10.1016/S0273-1177(03)00486-1
url: https://linkinghub.elsevier.com/retrieve/pii/S0273117703004861
|
| [11] |
任国玉, 郭军, 徐铭志, 等. 近50年中国地面气候变化基本特征[J]. 气象学报, 2005, 6:942-956.
|
| [11] |
Ren G Y, Guo J, Xu M Z, et al. Climate change of China’s mainland over the past half century[J]. Acta Meteorologica Sinica, 2005, 6:942-956.
|
| [12] |
Zhao B, Mao K, Cai Y, et al. A combined Terra and Aqua MODIS land surface temperature and meteorological station data product for China from 2003—2017[J]. Earth System Science Data, 2020, 12:2555-2577.
doi: 10.5194/essd-12-2555-2020
url: https://essd.copernicus.org/articles/12/2555/2020/
|
| [13] |
Mao K, Ma Y, Tan X, et al. Global surface temperature change analysis based on MODIS data in recent twelve years[J]. Advance Space Research, 2017, 59:503-512.
doi: 10.1016/j.asr.2016.11.007
url: https://linkinghub.elsevier.com/retrieve/pii/S0273117716306330
|
| [14] |
Neteler M. Estimating daily land surface temperatures in mountainous environments by reconstructed MODIS LST data[J]. Remote Sensing, 2010, 2(1):333-351.
doi: 10.3390/rs1020333
url: http://www.mdpi.com/2072-4292/2/1/333
|
| [15] |
Shen H, Li X, Cheng Q, et al. Missing information reconstruction of remote sensing data:A technical review[J]. IEEE Geoscience and Remote Sensing Magazine, 2015, 3(3):61-85.
|
| [16] |
Zhao L, Jin J, Wang S Y, et al. Integration of remote-sensing data with WRF to improve lake-effect precipitation simulations over the Great Lakes region[J]. Journal of Geophysical Research Atmospheres, 2012, 117(d9):1-12.
|
| [17] |
Mao K, Ma Y, Xia L, et al. Global aerosol change in the last decade:An analysis based on MODIS data[J]. Atmospheric Environment, 2014, 94:680-686.
doi: 10.1016/j.atmosenv.2014.04.053
url: https://linkinghub.elsevier.com/retrieve/pii/S1352231014003252
|
| [18] |
Cao M, Mao K, Yan Y, et al. A new global gridded sea surface temperature data product based on multisource data[J]. Earth System Science Data, 2021, 13:2111-2134.
doi: 10.5194/essd-13-2111-2021
url: https://essd.copernicus.org/articles/13/2111/2021/
|
| [19] |
Kerr Y H, Lagouarde J P, Imbernon J. Accurate land surface temperature retrieval from AVHRR data with use of an improved split window algorithm[J]. Remote Sensing of Environment, 1992, 41:197-209.
doi: 10.1016/0034-4257(92)90078-X
url: https://linkinghub.elsevier.com/retrieve/pii/003442579290078X
|
| [20] |
Mao K, Shi J, Li Z, et al. An RM-NN algorithm for retrieving land surface temperature and emissivity from EOS/MODIS data[J]. Journal of Geophysical Research-Atmosphere, 2007, 112(d21):1-17.
|
| [21] |
Pepin N, Bradley R S, Diaz H F, et al. Elevation-dependent warming in mountain regions of the world[J]. Nature Climate Change, 2015, 5:424-430.
doi: 10.1038/nclimate2563
url: https://doi.org/10.1038/nclimate2563
|
| [22] |
Halliday W E D. Climate,soils and forests of Canada[J]. Forestry Chronicle, 1950, 26:287-301.
doi: 10.5558/tfc26287-4
url: http://pubs.cif-ifc.org/doi/10.5558/tfc26287-4
|
| [23] |
Mao K, Qin Z, Shi J, et al. A practical split-window algorithm for retrieving land surface temperature from MODIS data[J]. International Journal of Remote Sensing, 2005, 26:3181-3204.
doi: 10.1080/01431160500044713
url: https://www.tandfonline.com/doi/full/10.1080/01431160500044713
|
| [24] |
Mao K, Shi J, Tang J, et al. A neural network technique for separating land surface emissivity and temperature from ASTER imagery[J]. IEEE Transactions on Geoscience and Remote Sensing, 2008, 46(1):200-208.
doi: 10.1109/TGRS.2007.907333
url: http://ieeexplore.ieee.org/document/4407630/
|
| [25] |
Xia L, Mao K, Ma Y, et al. An algorithm for retrieving land surface temperature using VIIRS data in combination with multi-sensors[J]. Sensors, 2014, 14:21385-21408.
doi: 10.3390/s141121385
url: http://www.mdpi.com/1424-8220/14/11/21385
|
| [26] |
Wan Z, Dozier J. A generalized split-window algorithm for retrieving land-surface temperature from space[J]. IEEE Transactions on Geoscience and Remote Sensing, 1996, 34(4):892-905.
doi: 10.1109/36.508406
url: http://ieeexplore.ieee.org/document/508406/
|
| [27] |
Wan Z, Li Z L. A physics-based algorithm for retrieving land-surface emissivity and temperature from EOS/MODIS data[J]. IEEE Transactions on Geoscience and Remote Sensing, 1997, 35(4):980-996.
doi: 10.1109/36.602541
url: http://ieeexplore.ieee.org/document/602541/
|
| [28] |
Fang S, Mao K, Xia X, et al. Dataset of daily near-surface air temperature in China from 1979 to 2018[J]. Earth System Science Data, 2022, 14:1413-1432.
doi: 10.5194/essd-14-1413-2022
url: https://essd.copernicus.org/articles/14/1413/2022/
|
| [29] |
Wang P, Mao K, Meng F, et al. A daily highest air temperature estimation method and spatial-temporal changes analysis of high temperature in China from 1979 to 2018[J]. Geoscientific Model Development, 2022, 15:6059-6083.
doi: 10.5194/gmd-15-6059-2022
url: https://gmd.copernicus.org/articles/15/6059/2022/
|
| [30] |
Hansen J, Lebedeff S. Global trends of measured surface air temperature[J]. Journal of Geophysical Research Atmospheres, 1987, 92(d11):13345-13372.
doi: 10.1029/JD092iD11p13345
url: http://doi.wiley.com/10.1029/JD092iD11p13345
|
| [31] |
Julien Y, Sobrino J A, Verhoef W. Changes in land surface temperatures and NDVI values over Europe between 1982 and 1999[J]. Remote Sensing of Environment, 2006, 103(1):43-55.
doi: 10.1016/j.rse.2006.03.011
url: https://linkinghub.elsevier.com/retrieve/pii/S0034425706001246
|
| [32] |
Wang H, Mao K, Yuan Z, et al. A method for land surface temperature retrieval based on model-data-knowledge-driven and deep learning[J]. Remote Sensing of Environment, 2021, 265:1-19.
|
| [33] |
Remer L A, Kleidman R G, Levy R C, et al. Global aerosol climatology from the MODIS satellite sensors[J]. Journal of Geophysical Research, 2008, 113(d14):1-18.
|
| [34] |
Platnick S. The MODIS cloud products:Algorithms and examples from Terra[J]. IEEE Transactions on Geoscience and Remote Sensing, 2003, 41(2):459-473.
doi: 10.1109/TGRS.2002.808301
url: http://ieeexplore.ieee.org/document/1196061/
|
| [35] |
Held I M, Soden B J. Robust responses of the hydrological cycle to global warming[J]. Journal of Climate, 2006, 19(21):5686-5699.
doi: 10.1175/JCLI3990.1
url: http://journals.ametsoc.org/doi/10.1175/JCLI3990.1
|
| [36] |
Mao K, Yuan Z, Zuo Z, et al. Changes in global cloud cover based on remote sensing data from 2003 to 2012[J], Chinese Geographical Science, 2019, 29(2):306-315.
doi: 10.1007/s11769-019-1030-6
url: https://doi.org/10.1007/s11769-019-1030-6
|
| [37] |
Yan Y, Mao K, Shi J, et al. Driving forces of land surface temperature anomalous changes in North America in 2002—2018[J]. Scientific Reports, 2020, 6931(10):1-13.
|
| [38] |
Hinzman L D, Bettez N D, Bolton W R, et al. Evidence and implications of recent climate change in Northern Alaska and other arctic regions[J]. Climatic Change, 2005, 72(3):251-298.
doi: 10.1007/s10584-005-5352-2
url: http://link.springer.com/10.1007/s10584-005-5352-2
|
|
Viewed |
|
|
|
Full text
|
|
|
|
|
Abstract
|
|
|
|
|
Cited |
|
|
|
|
| |
Shared |
|
|
|
|
| |
Discussed |
|
|
|
|
 2022,
Vol. 34
2022,
Vol. 34