|
|
|
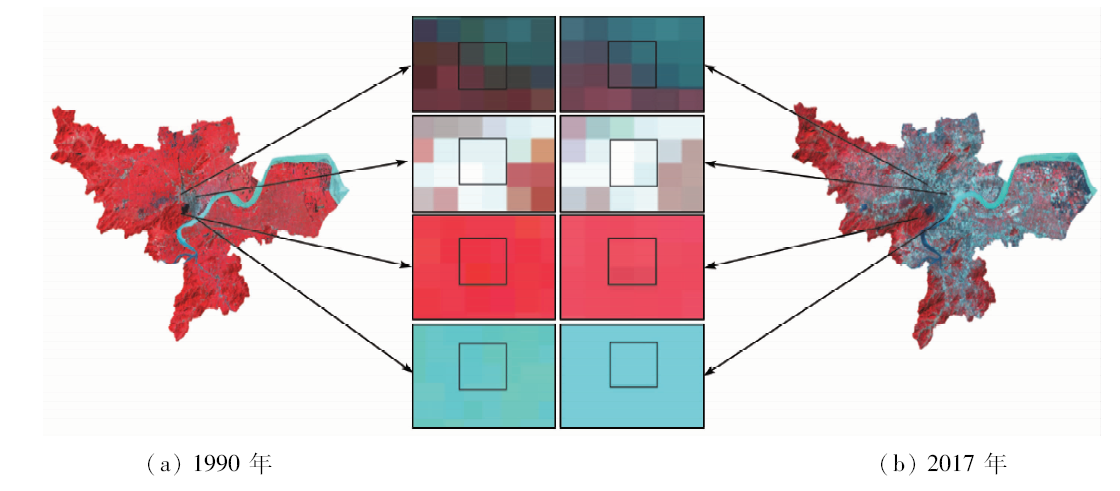
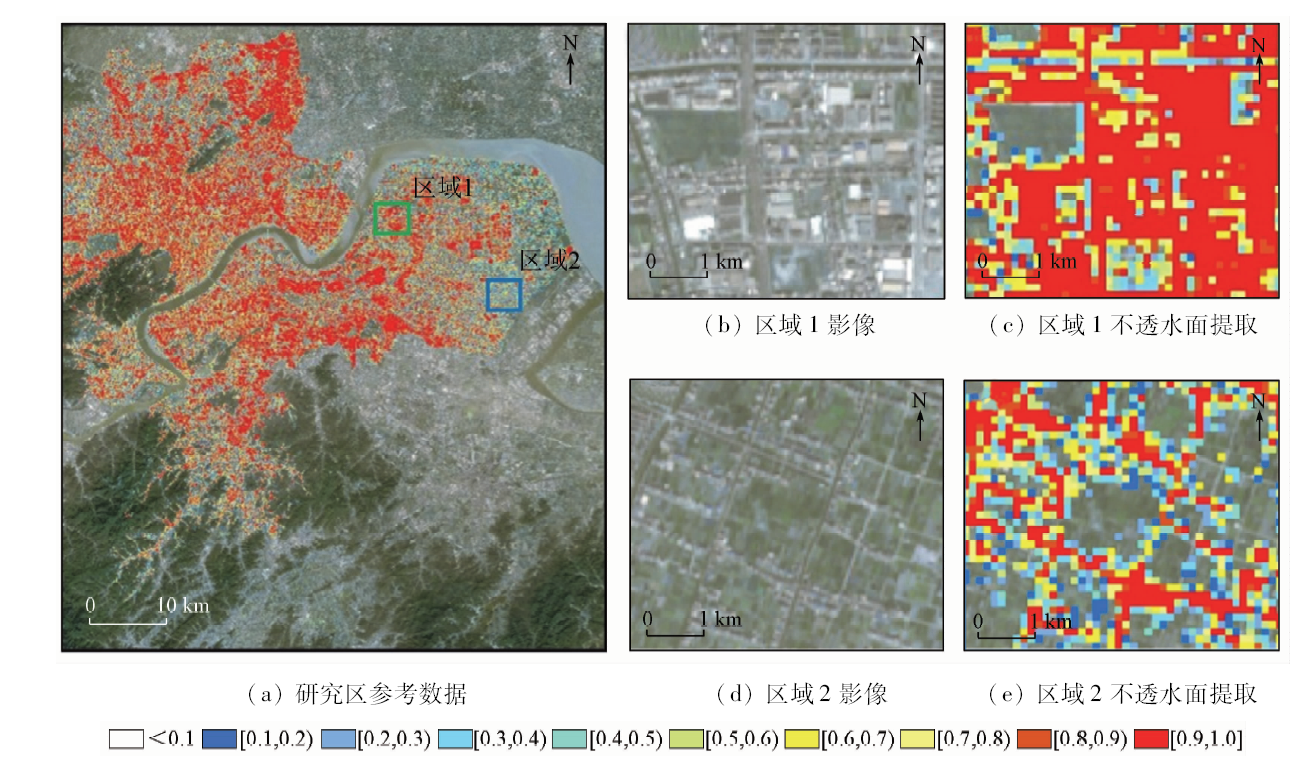
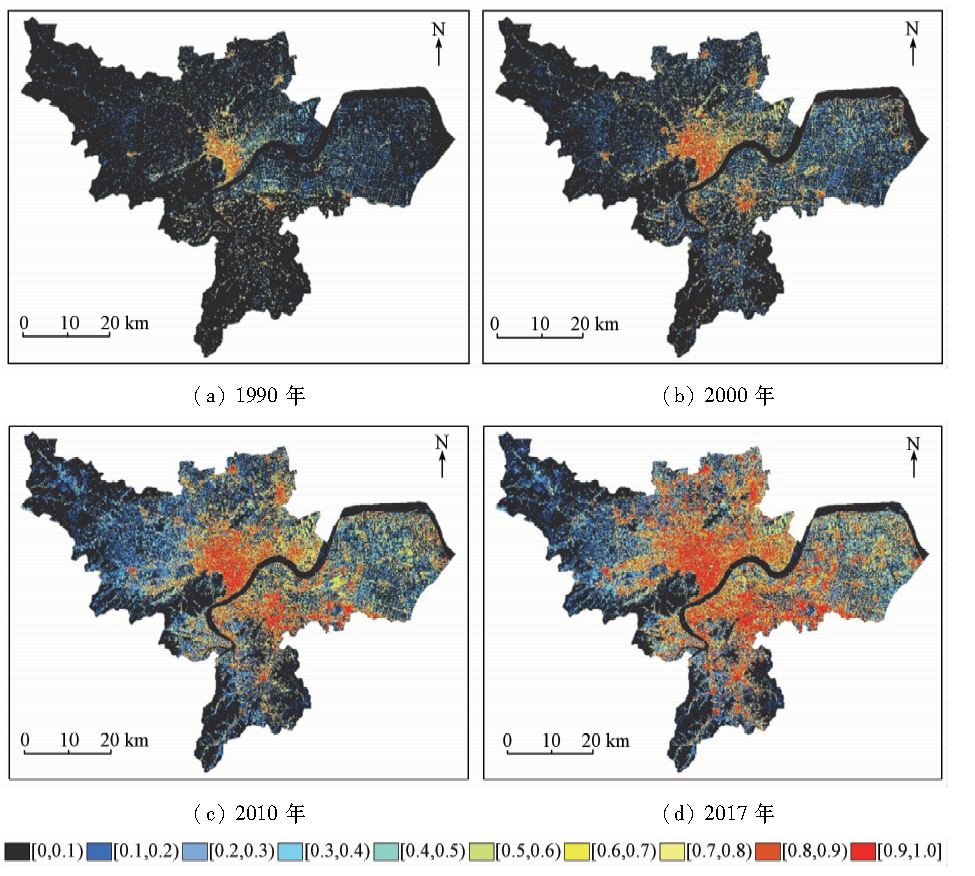
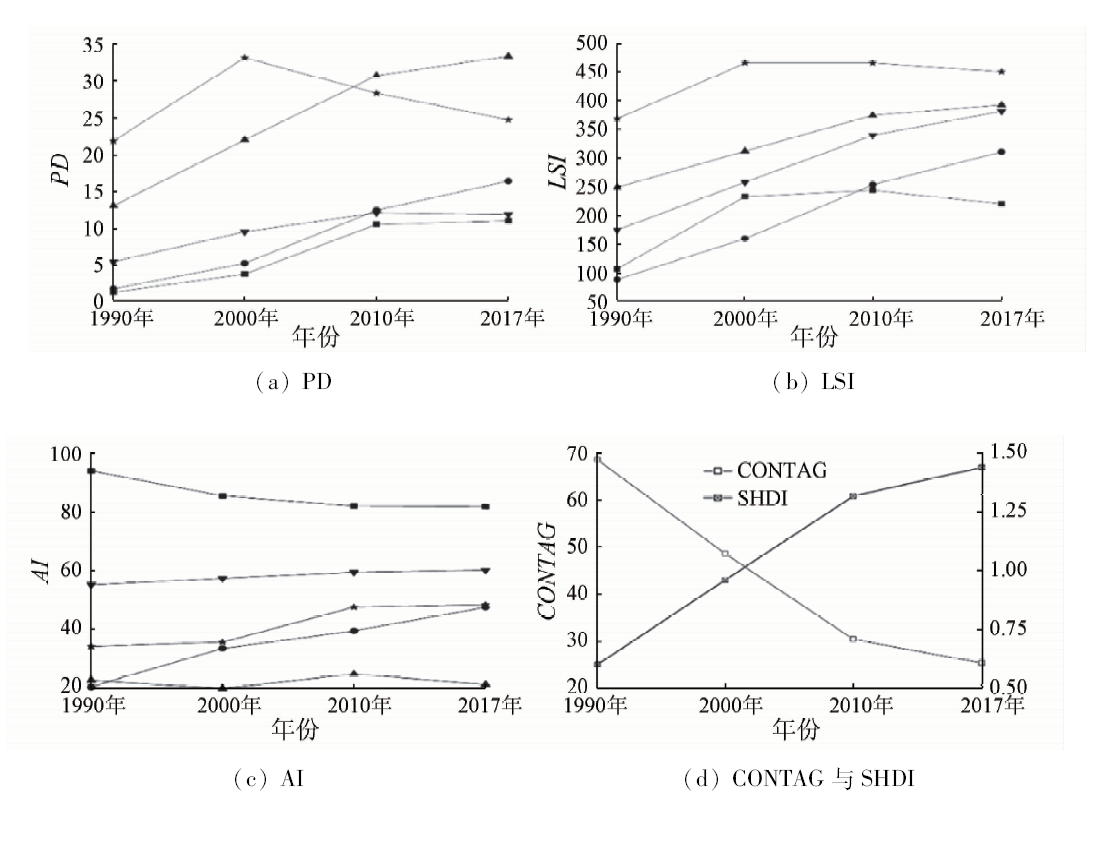
Abstract The impervious surface percentage is an important indicator of regional urbanization and ecological environment changes. The spatial and temporal distribution of impervious surface percentage can reveal the current and future development potential of the city, and provide a reference for urban environmental protection and green sustainable development. In this paper, Hangzhou was selected as the study area, and one Sentinel-2B satellite image was used to extract the impervious surface percentage as reference data. Based on the four-phase Landsat satellite imagery, the authors used the random forest algorithm to invert the 30 m spatial resolution impervious surface percentage datasets from 1990 to 2017 in Hangzhou. The accuracy verification results show that the mean absolute error is from 6.3% to 6.7%, and the root mean square error is from 13.40% to 14.25%, indicating that the inversion model has great accuracy and can accurately reflect the spatial distribution of the impervious surface. Based on the impervious surface weighted mean center, standard deviation ellipse and landscape pattern index, the authors analyzed the spatial and temporal patterns of impervious surface in Hangzhou. The results are as follows: The impervious surface percentage in Hangzhou was increasing from 1990 to 2017, and the annual average growing of impervious surface percentage was the fastest from 2010 to 2017, mainly concentrated in Yuhang and Xiaoshan; Due to the unbalanced development of Hangzhou between 1990 and 2017, the impervious surface weighting mean centre moved to northeast at first, then moved to south, and finally moved to north; The northwest-southeast profile was the main direction of urban growth and the gathering trend was relatively stable in Hangzhou; The change of landscape pattern shows that the impervious landscapes of all types were increasing, and were distributed in a balanced trend; The natural surface, medium density and super high density impervious landscapes became less aggregated and increasingly fragmented; The aggregation of the impervious landscapes of all types was relatively stable, the highest degree of aggregation was the natural surface, and the lowest was the medium density impervious landscape.
|
| Keywords
impervious surface
change detection
time series
Hangzhou
random forest
|
|
|
|
Corresponding Authors:
Jiaqi ZUO
E-mail: 123354087@qq.com
|
|
Issue Date: 18 June 2020
|
|
|
| [1] |
Alberti M. The effects of urban patterns on ecosystem function[J]. International regional science review, 2005,28(2):168-192.
|
| [2] |
Arnold C J, Gibbons C J. Impervious surface coverage:The emergence of a key environmental indicator[J]. Journal of the American Planning Association, 1996,62(2):243-258.
|
| [3] |
刘畅, 杨康, 程亮, 等. Landsat8不透水面遥感信息提取方法对比[J]. 国土资源遥感, 2019,31(3):148-156.doi: 10.6046/gtzyyg.2019.03.19.
|
| [3] |
Liu C, Yang K, Cheng L, et al. Comparison of Landsat8 impervious surface extraction methods[J]. Remote Sensing for Land and Resources, 2019,31(3):148-156.doi: 10.6046/gtzyyg.2019.03.19.
|
| [4] |
左家旗, 王泽根, 边金虎, 等. 地表不透水面比例遥感反演研究综述[J]. 国土资源遥感, 2019,31(3):20-28.doi: 10.6046/gtzyyg.2019.03.03.
|
| [4] |
Zuo J Q, Wang Z G, Bian J H, et al. A review of research on remote sensing for ground impervious surface percentage retrieval[J]. Remote Sensing for Land and Resources, 2019,31(3):20-28.doi: 10.6046/gtzyyg.2019.03.03.
|
| [5] |
王浩, 吴炳方, 李晓松, 等. 流域尺度的不透水面遥感提取[J]. 遥感学报, 2011,15(2):388-400.
doi: 10.11834/jrs.20110288
url: http://www.jors.cn/jrs/ch/reader/view_abstract.aspx?file_no=r10288&flag=1
|
| [5] |
Wan H, Wu B F, Li X S, et al. Extraction of impervious surface in Hai Basin using remote sensing[J]. Journal of Remote Sensing, 2011,15(2):388-400.
doi: 10.11834/jrs.20110288
url: http://www.jors.cn/jrs/ch/reader/view_abstract.aspx?file_no=r10288&flag=1
|
| [6] |
张晓萍, 吕颖, 张华国, 等. 1990—2011年舟山群岛不透水面动态遥感分析[J]. 国土资源遥感, 2018,30(2):178-185.doi: 10.6046/gtzyyg.2018.02.04.
|
| [6] |
Zhang X P, Lyu Y, Zhang H G, et al. Remote sensing analysis of impervious surface changes in Zhoushan Islands during 1990—2011[J]. Remote Sensing for Land and Resources, 2018,30(2):178-185.doi: 10.6046/gtzyyg.2018.02.04.
|
| [7] |
Wu C, Murray A T. Estimating impervious surface distribution by spectral mixture analysis[J]. Remote Sensing of Environment, 2003,84(4):493-505.
|
| [8] |
丛浩, 张良培, 李平湘. 一种端元可变的混合像元分解方法[J]. 中国图象图形学报, 2006,11(8):1092-1096.
|
| [8] |
Cong H, Zhang L P, Li P X. A method of selected endmember for pixel unmixing[J]. Journal of Image and Graphics, 2006,11(8):1092-1096.
|
| [9] |
李晓宁, 张友静, 佘远见, 等. CART集成学习方法估算平原河网区不透水面覆盖度[J]. 国土资源遥感, 2013,25(4):174-179.doi: 10.6064/gtzyyg.2013.04.28.
doi: 10.6046/gtzyyg.2013.04.28
url: http://www.gtzyyg.com/CN/abstract/abstract1696.shtml
|
| [9] |
Li X N, Zhang Y J, She Y J, et al. Estimation of impervious surface percentage of river network regions using an ensemble leaning of CART analysis[J]. Remote Sensing for Land and Resource, 2013,25(4):174-179.doi: 10.6064/gtzyyg.2013.04.28.
|
| [10] |
岳文泽, 汪锐良, 范蓓蕾. 城市扩张的空间模式研究——以杭州市为例[J]. 浙江大学学报(理学版), 2013,40(5):596-605.
|
| [10] |
Yue W Z, Wang R L, Fan P L. Spatial patterns analysis of urban expansion in Hangzhou City[J]. Journal of Zhejiang University(Science Edition), 2013,40(5):596-605.
|
| [11] |
王伟武, 朱婷媛, 杨华杰. 基于杭州不透水地面信息的城市扩张驱动力研究[J].建筑与文化, 2015(4):146-147.
|
| [11] |
Wang W W, Zhu T Y, Yang H J. Research on driving forces of urban expansion based on the impervious surface information of Hangzhou[J].Architecture and Culture, 2015(4):146-147.
|
| [12] |
Li L, Lu D, Kuang W. Examining urban impervious surface distribution and its dynamic change in Hangzhou metropolis[J]. Remote Sensing, 2016,8(3):265.
|
| [13] |
李波. 基于多源遥感数据的城市建设用地空间扩展动态监测及其动力学模拟研究[D]. 杭州:浙江大学, 2012.
|
| [13] |
Li B. Dynamic monitoring and simulation of urban spatial expansion using multi-sources remote sensing data[D]. Hangzhou:Zhejiang University, 2012.
|
| [14] |
郑飞, 张殿发, 孙伟伟, 等. 基于ASTER遥感的杭州城市热/冷岛的景观特征分析[J]. 遥感技术与应用, 2017,32(5):938-947.
|
| [14] |
Zheng F, Zhang D F, Sun W W, et al. Analysis of landscape characteristic of urban heat/sink island in Hangzhou based on ASTER remote sensing imagery[J]. Remote Sensing Technology and Application, 2017,32(5):938-947.
|
| [15] |
Breiman L. Random Forests[J]. Machine Learning, 2001,45(1):5-32.
|
| [16] |
Shahi K, Shafri H Z M, Taherzadeh E, et al.A novel spectral index to automatically extract road networks from WorldView-2 satellite imagery[J]. Egyptian Journal of Remote Sensing and Space Sciences, 2015,18(1):27-33.
|
| [17] |
徐涵秋. 利用改进的归一化差异水体指数(MNDWI)提取水体信息的研究[J]. 遥感学报, 2005,9(5):589-595.
doi: 10.11834/jrs.20050586
url: http://www.jors.cn/jrs/ch/reader/view_abstract.aspx?file_no=20050586&flag=1
|
| [17] |
Xu H Q. A study on information extraction of water body with modified normalized difference water index(MNDWI)[J]. Journal of Remote Sensing, 2005,9(5):589-595.
doi: 10.11834/jrs.20050586
url: http://www.jors.cn/jrs/ch/reader/view_abstract.aspx?file_no=20050586&flag=1
|
| [18] |
Kaufman Y J, Tanré D. Atmospherically resistant vegetation index(ARVI) for EOS-MODIS[J]. IEEE Transactions on Geoscience and Remote Sensing, 1992,30(2):261-270.
|
| [19] |
查勇, 倪绍祥, 杨山. 一种利用TM图像自动提取城镇用地信息的有效方法[J]. 遥感学报, 2003,7(1):37-40,82.
|
| [19] |
Zha Y, Ni S X, Yang S. An effective approach to automatically extract urban land-use from TM imagery[J]. Journal of Remote Sensing, 2003,7(1):37-40,82.
|
| [20] |
Huete A R. A soil-adjusted vegetation index(SAVI)[J]. Remote Sensing of Environment, 1988,25(3):295-309.
|
| [21] |
Xu H. A new index for delineating built-up land features in satellite imagery[J]. International Journal of Remote Sensing, 2008,29(14):4269-4276.
|
| [22] |
Lefever D.W. Measuring geographic concentration by means of the standard deviational ellipse[J]. American Journal of Sociology, 1926,32(1):88-94.
doi: 10.1086/214027
url: https://www.journals.uchicago.edu/doi/10.1086/214027
|
| [23] |
邬建国. 景观生态学-格局、过程、尺度与等级(第二版)[M]. 北京: 高等教育出版社, 2007: 103-125.
|
| [23] |
Wu J G. Landscape ecology-pattern,process,scale and hierarchy(2nd edition)[M]. Beijing: Higher Education Press, 2007: 103-125.
|
| [24] |
翟俊, 侯鹏, 赵志平, 等. 青海湖流域景观格局空间粒度效应分析[J]. 国土资源遥感, 2018,30(3):159-166.doi: 10.6046/gtzyyg.2018.03.22.
|
| [24] |
Zhai J, Hou P, Zhao Z P, et al. An analysis of landscape pattern spatial grain size effects in Qinghai Lake watershed[J]. Remote Sensing for Land and Resources, 2018,30(3):159-166.doi: 10.6046/gtzyyg.2018.03.22.
|
| [25] |
Sexton J O, Song X P, Huang C, et al. Urban growth of the Washington,D.C.-Baltimore,MD metropolitan region from 1984 to 2010 by annual,Landsat-based estimates of impervious cover[J]. Remote Sensing of Environment, 2013,129(2):42-53.
doi: 10.1016/j.rse.2012.10.025
url: https://linkinghub.elsevier.com/retrieve/pii/S0034425712004130
|
|
Viewed |
|
|
|
Full text
|
|
|
|
|
Abstract
|
|
|
|
|
Cited |
|
|
|
|
| |
Shared |
|
|
|
|
| |
Discussed |
|
|
|
|
 2020,
Vol. 32
2020,
Vol. 32
 )
)