|
|
 |
|

|
|
|
Spatiotemporal changes in land use and their driving factors in the Golmud River basin from 1980 to 2020 |
MA Maonan1,2( ), CHANG Liang1, YU Guoqiang1(), ZHOU Jianwei3, HAN Haihui1, ZHANG Qunhui1, CHEN Xiaoyan1, DU Chao4 ), CHANG Liang1, YU Guoqiang1(), ZHOU Jianwei3, HAN Haihui1, ZHANG Qunhui1, CHEN Xiaoyan1, DU Chao4 |
1. Xi’an Center, China Geological Survey, Xi’an 710119, China
2. Institute of Geological Survey, China University of Geosciences (Wuhan), Wuhan 430074, China
3. School of Environmental Studies, China University of Geosciences (Wuhan), Wuhan 430074, China
4. Geological Survey Academy of Inner Mongolia Autonomous Region, Hohhot 010020, China |
|
|
|
|
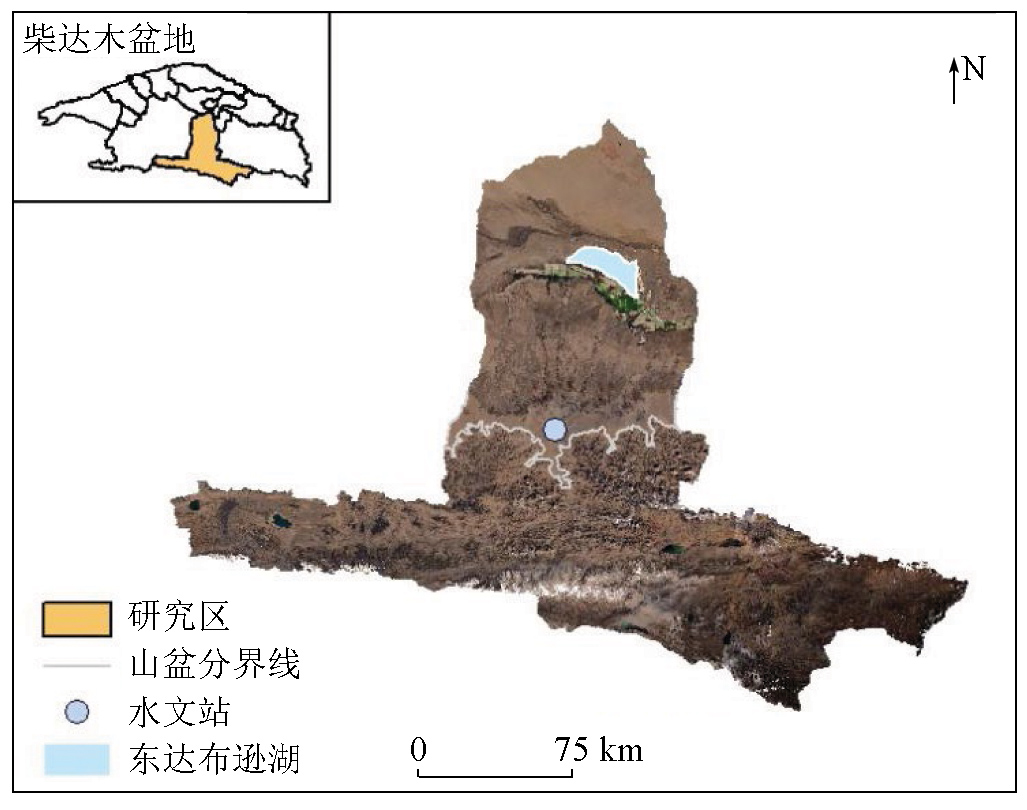
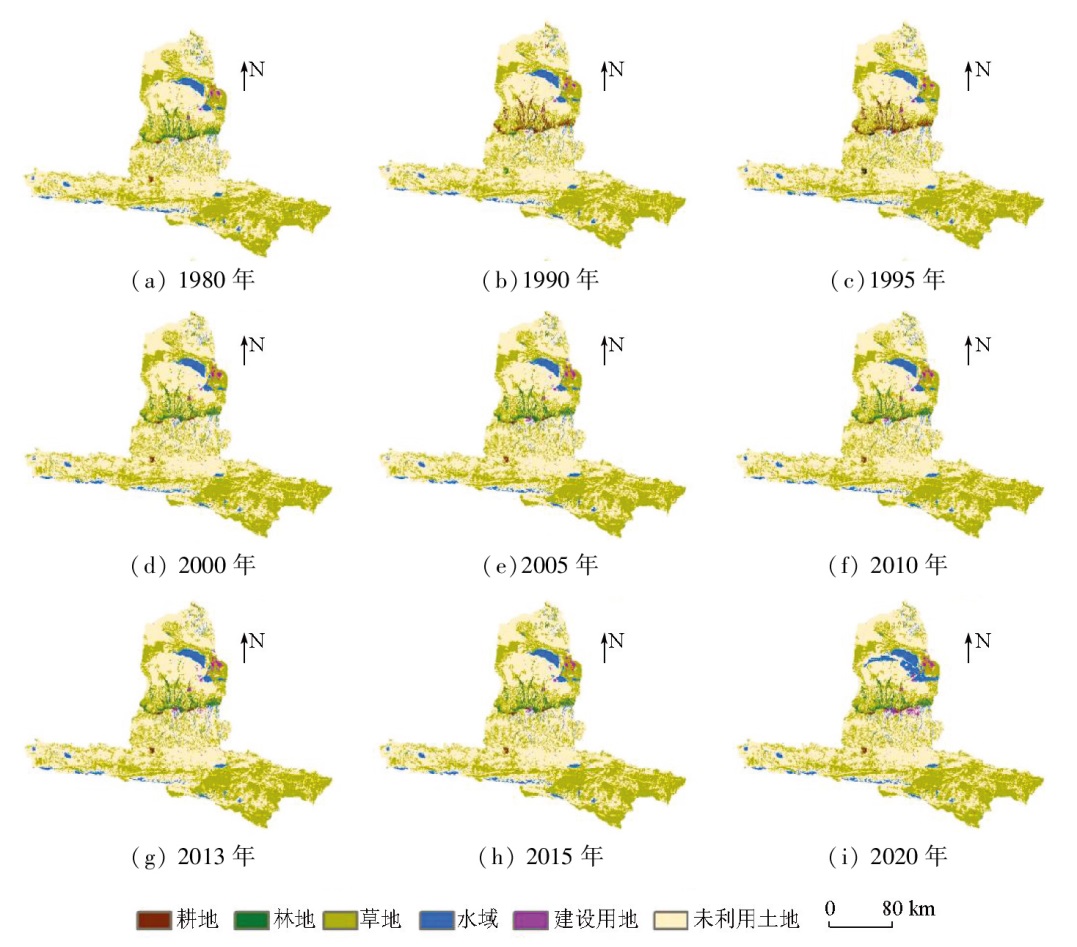
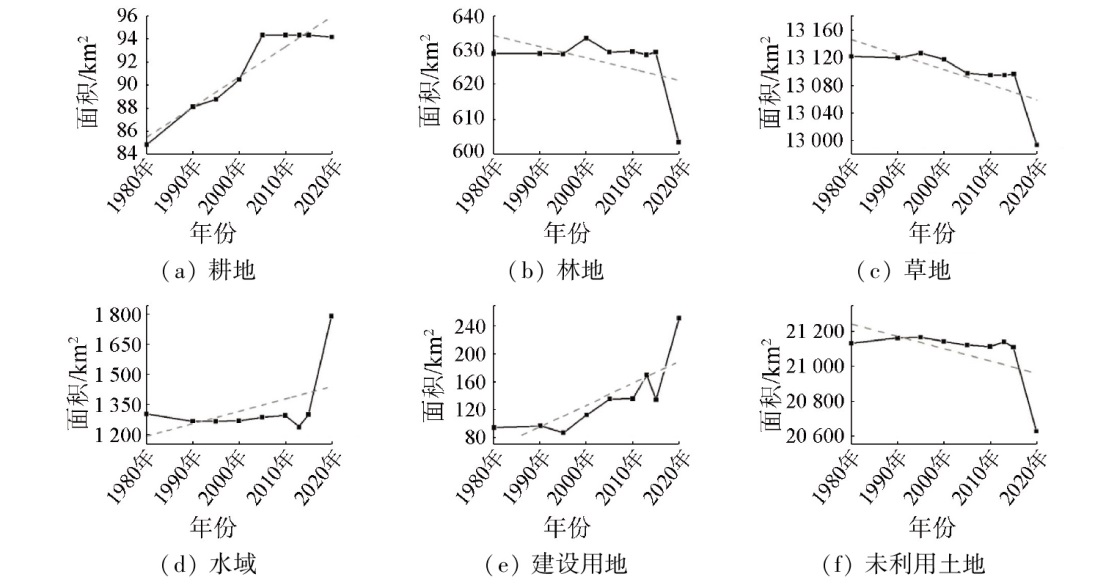
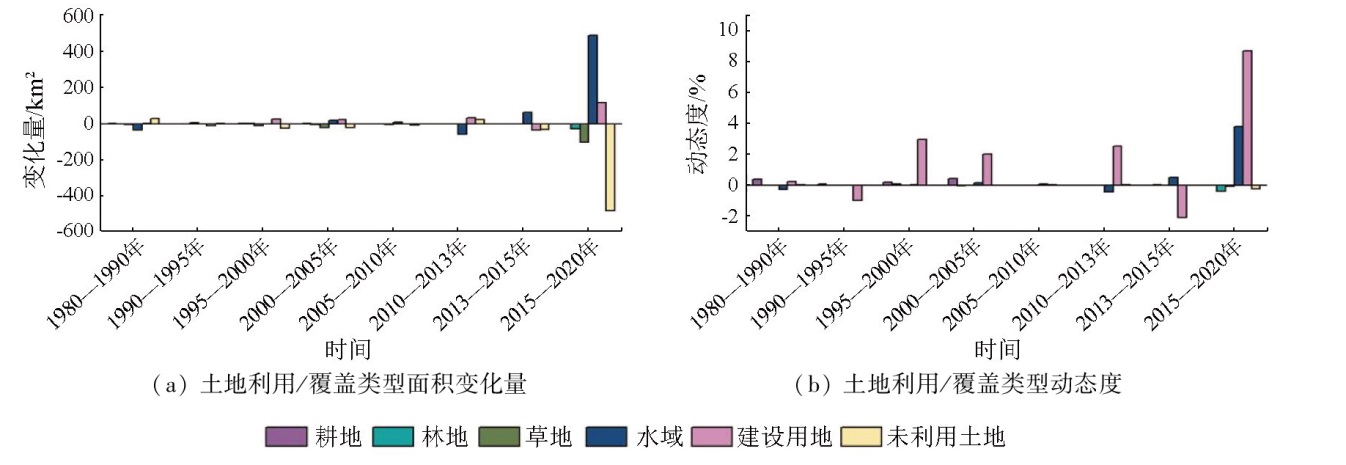
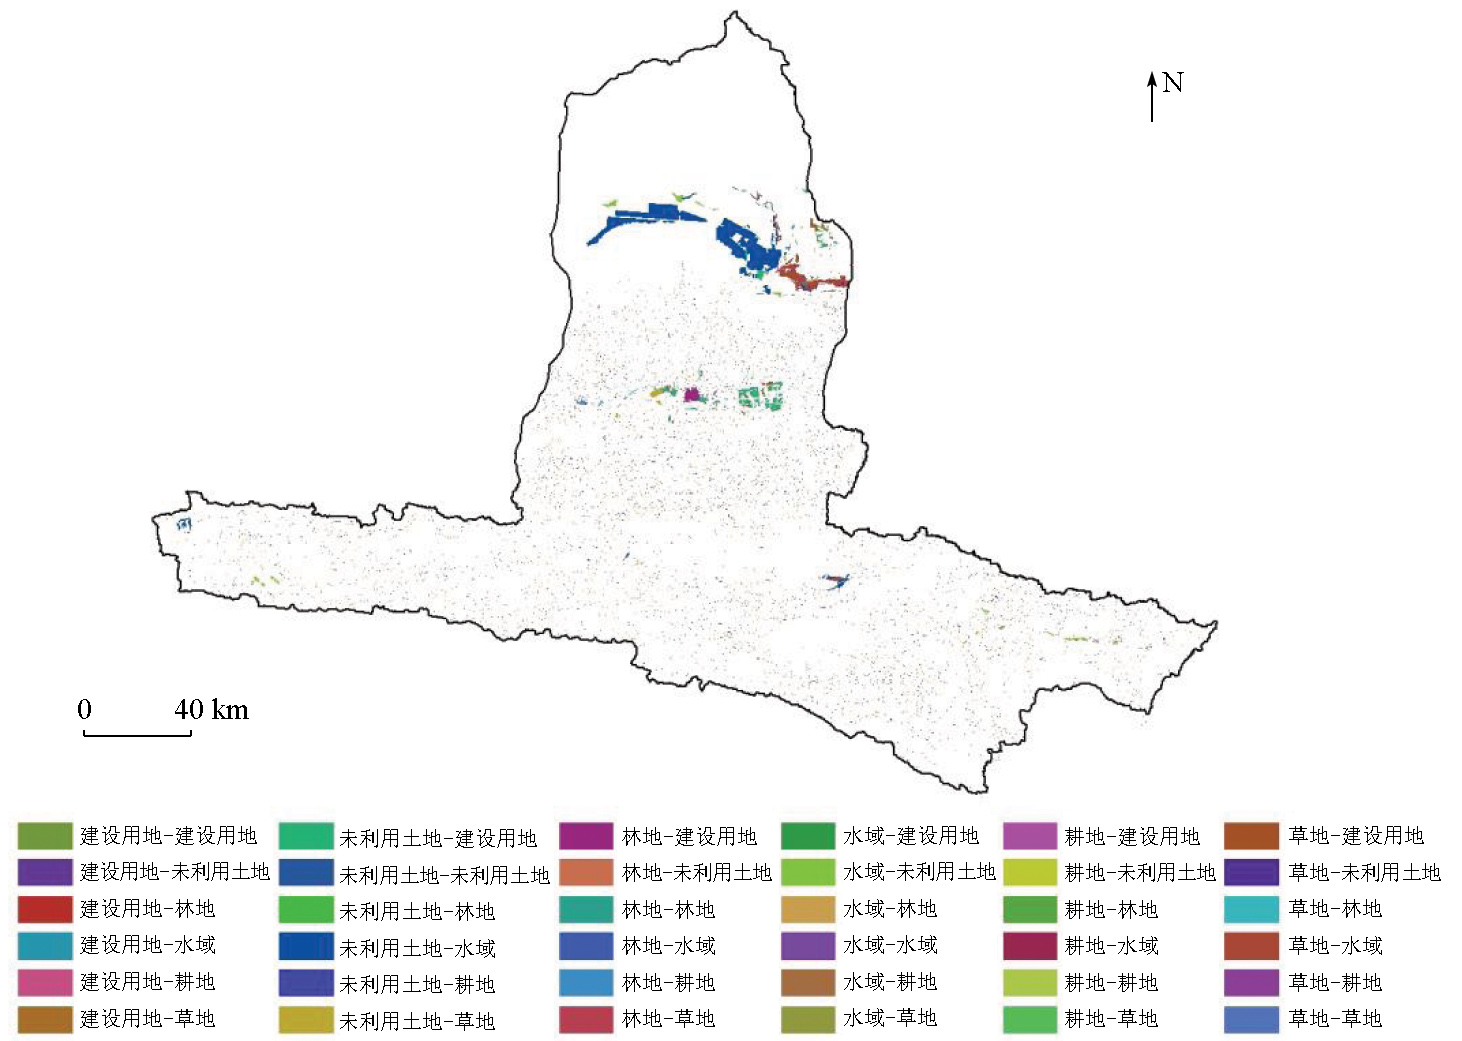
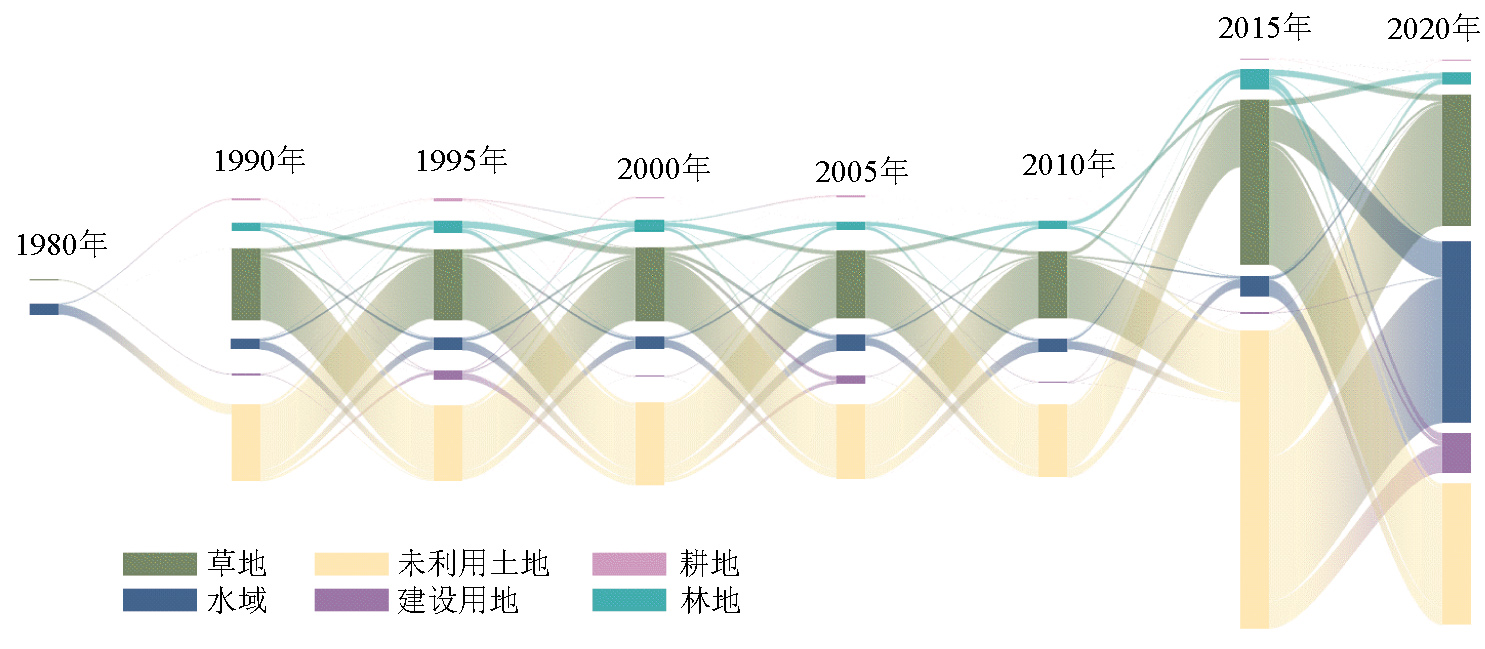
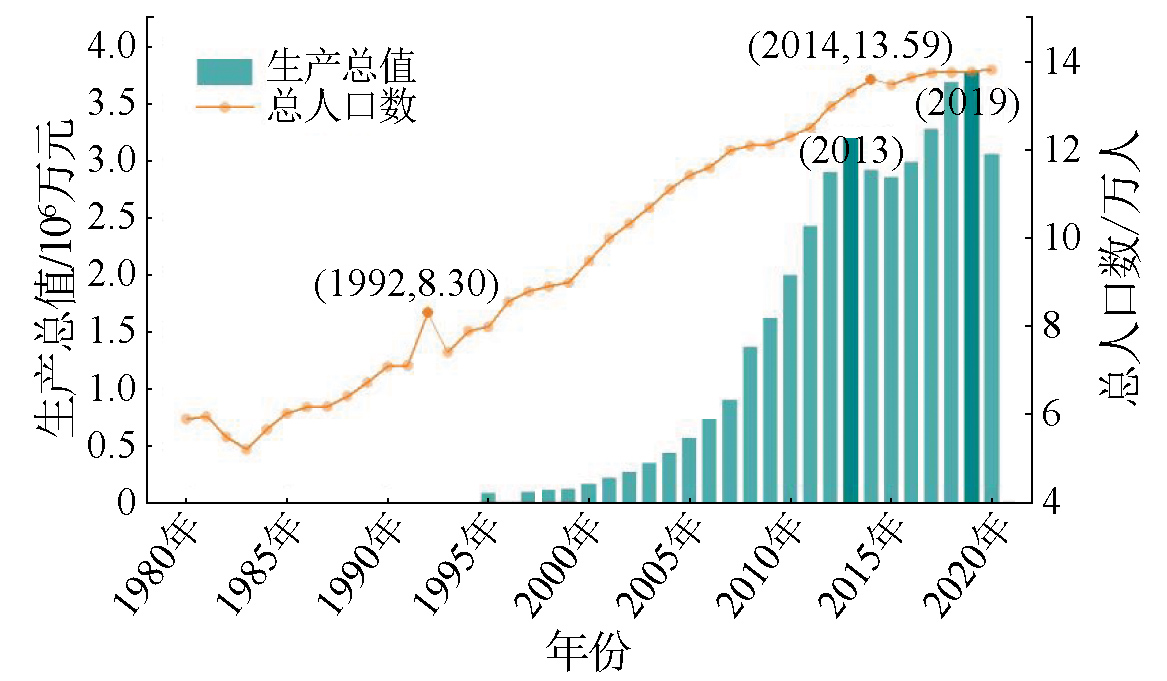
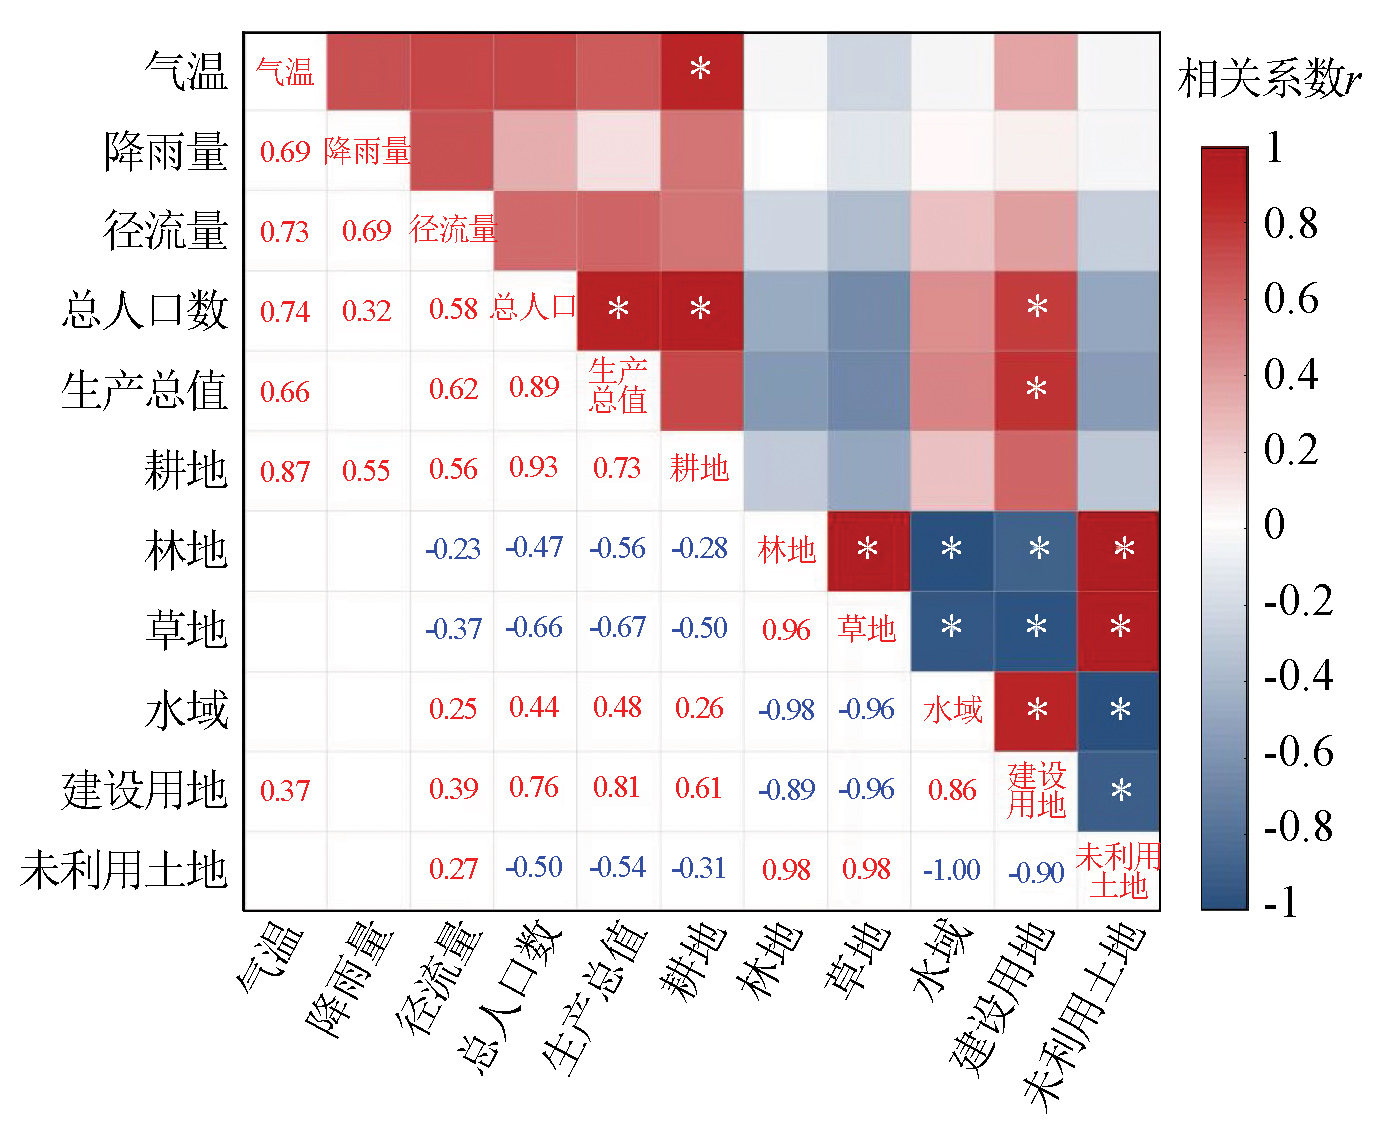
Abstract Land use serves as the primary cause of global environmental changes. Therefore, investigating its spatiotemporal changes and corresponding driving factors is significant for promoting the sustainable development of regional socioeconomics and ecosystems. Based on nine stages of remote sensing monitoring data on land use/land cover from 1980 to 2020, this study analyzed the spatiotemporal changes in land use types in the Golmud River basin. By combining the analysis of significant correlations, this study explored the major factors driving changes in land use within the basin. The results indicate that over the past 40 years, unused land and grassland proved to be dominant land use types in the Golmud River basin. The areas of cultivated lands, water bodies, and construction lands exhibited an increasing trend, while those of forest lands, grasslands, and unused lands trended downward. The period from 2015 to 2020 witnessed significant changes in both the areas and the dynamic degrees of various land use types within the basin. During this period, spatial changes in land use transition predominately occurred in the central and northern parts of the basin. Between 1980 and 2020, the unused land showed significant fragmentation. Human activities, particularly total population and regional gross domestic product, were identified as the main factors driving changes in the land use type within the basin.
|
| Keywords
land use
spatiotemporal change
driving factor
correlation analysis
Golmud River basin
|
|
|
|
Issue Date: 03 September 2025
|
|
|
| [1] |
范泽孟. 基于SSP-RCP不同情景的京津冀地区土地覆被变化模拟[J]. 地理学报, 2022, 77(1):228-244.
doi: 10.11821/dlxb202201016
|
| [1] |
Fan Z M. Simulation of land cover change in Beijing-Tianjin-Hebei Region under different SSP-RCP scenarios[J]. Acta Geographica Sinica, 2022, 77(1):228-244.
doi: 10.11821/dlxb202201016
|
| [2] |
Foley J A, Defries R, Asner G P, et al. Global consequences of land use[J]. Science, 2005, 309(5734):570-574.
doi: 10.1126/science.1111772
pmid: 16040698
|
| [3] |
Turner B L, Janetos A C, Verburg P H, et al. Land system architecture:Using land systems to adapt and mitigate global environmental change[J]. Global Environmental Change, 2013, 23(2):395-397.
|
| [4] |
周厚侠. 黑河中游区域土地利用/土地覆盖变化及环境热效应研究[D]. 北京: 中国矿业大学(北京), 2016.
|
| [4] |
Zhou H X. Study on the area of land use/land cover change and environmental thermal effect in the middle reaches of Hei River[D]. Beijing: China University of Mining and Technology, Beijing, 2016.
|
| [5] |
Turner M G, Romme W H, Gardner R H, et al. Effects of fire size and pattern on early succession in Yellowstone National Park[J]. Ecological Monographs, 1997, 67(4):411.
|
| [6] |
Turner B L. Local faces,global flows:The role of land use and land cover in global environmental change[J]. Land Degradation and Development, 1994, 5(2):71-78.
|
| [7] |
Geist H J, Lambin E F. Proximate causes and underlying driving forces of tropical deforestation[J]. BioScience, 2002, 52(2):143.
|
| [8] |
覃德华. 闽东土地利用/覆盖变化的时空分异规律及其区域生态安全综合评价[D]. 福州: 福建农林大学, 2010.
|
| [8] |
Qin D H. Research on the spatio-temporal distribution laws of LUCC and regional eco-security comprehensive assessment in Mindong[D]. Fuzhou: Fujian Agriculture and Forestry University, 2010.
|
| [9] |
夏慧玲. 深圳市宝安区LUCC驱动力的时空分异研究[D]. 武汉: 华中农业大学, 2009.
|
| [9] |
Xia H L. Temporal and spatial variation of LUCC driving forces in Bao’an District,Shenzhen[D]. Wuhan: Huazhong Agricultural University, 2009.
|
| [10] |
朱永华, 张生, 孙标, 等. 西辽河流域通辽平原区地下水埋深与植被及土壤特征的关系[J]. 水土保持通报, 2019, 39(1):29-36.
|
| [10] |
Zhu Y H, Zhang S, Sun B, et al. Relationship between groundwater depth and characteristics of vegetation and soil in Tongliao Plain[J]. Bulletin of Soil and Water Conservation, 2019, 39(1):29-36.
|
| [11] |
梁露霜. 祁连山区土地利用/覆被变化(LUCC)的时空动态及其景观生态风险评价[D]. 兰州: 兰州大学, 2023.
|
| [11] |
Liang L S. Spatiotemporal dynamics of land use/cover change (LUCC) and landscape ecological risk assessment in the Qilian Mountains[D]. Lanzhou: Lanzhou University, 2023.
|
| [12] |
彭海月, 任燕, 李琼, 等. 青藏高原土地利用/覆被时空变化特征[J]. 长江科学院院报, 2022, 39(8):41-49,57.
doi: 10.11988/ckyyb.20210470
|
| [12] |
Peng H Y, Ren Y, Li Q, et al. Spatial and temporal land use/cover change characteristics of Qinghai-Tibet Plateau[J]. Journal of Yangtze River Scientific Research Institute, 2022, 39(8):41-49,57.
|
| [13] |
张镱锂, 刘林山, 王兆锋, 等. 青藏高原土地利用与覆被变化的时空特征[J]. 科学通报, 2019, 64(27):2865-2875.
|
| [13] |
Zhang Y L, Liu L S, Wang Z F, et al. Spatial and temporal characteristics of land use and cover changes in the Tibetan Plateau[J]. Chinese Science Bulletin, 2019, 64(27):2865-2875.
|
| [14] |
彭建, 蔡运龙, 何钢, 等. 喀斯特生态脆弱区猫跳河流域土地利用/覆被变化研究[J]. 山地学报, 2007, 25(5):566-576.
|
| [14] |
Peng J, Cai Y L, He G, et al. Land use/cover change in ecologically fragile kast areas:A case study in Maotiaohe River basin,Guizhou China[J]. Journal of Mountain Science, 2007, 25(5):566-576.
|
| [15] |
姜宁宁. 基于GIS的渭北旱塬LUCC分析及其驱动力研究——以陕西省澄城县为例[D]. 西安: 西北大学, 2011.
|
| [15] |
Jiang N N. Analysis and reasearch on LUCC and its driving forces in Weibei Dry Highland based on GIS:A case study of Chengcheng County in Shaanxi[D]. Xi’an: Northwest University, 2011.
|
| [16] |
阿依苏力坦·麦麦提艾力. 博斯腾湖流域土地利用/覆被变化及其驱动因子分析[D]. 乌鲁木齐: 新疆师范大学, 2014.
|
| [16] |
Ayisulitan M. Study on the land use/cover change and analyze driving forces of Bosten Lake basin[D]. Urumqi: Xinjiang Normal University, 2014.
|
| [17] |
程磊, 徐宗学, 罗睿, 等. 渭河流域1980—2000年LUCC时空变化特征及其驱动力分析[J]. 水土保持研究, 2009, 16(5):1-6,30,287.
|
| [17] |
Cheng L, Xu Z X, Luo R, et al. Spatial-temporal characteristics of LUCC and driving factor analysis for the Wei River basin from 1980 to 2000[J]. Research of Soil and Water Conservation, 2009, 16(5):1-6,30,287.
|
| [18] |
Yang X, Ren L, Liu Y, et al. Hydrological response to land use and land cover changes in a sub-watershed of West Liaohe River basin,China[J]. Journal of Arid Land, 2014, 6(6):678-689.
|
| [19] |
马志昂, 盖艾鸿, 孙林军. 格尔木市盆地地区土地利用/覆盖变化时空演变[J]. 水土保持通报, 2015, 35(5):268-273,278.
|
| [19] |
Ma Z A, Gai A H, Sun L J. Spatial-temporal evolution of land use/cover change in Golmud Basin[J]. Bulletin of Soil and Water Conservation, 2015, 35(5):268-273,278.
|
| [20] |
张梨梨. 格尔木—南山口铁路沿线土地利用/覆盖变化研究[D]. 北京: 中国地质大学(北京), 2014.
|
| [20] |
Zhang L L. Land use/cover change research of the Qinghai-Tibet Railway-Golmud-Nanshankou from case[D]. Beijing: China University of Geosciences, 2014.
|
| [21] |
宁黎平, 韩丽蓉, 宋宜容, 等. 格尔木市区土地利用动态遥感调查[J]. 青海大学学报(自然科学版), 2005, 23(3):23-26.
|
| [21] |
Ning L P, Han L R, Song Y R, et al. Remote sensing investigation in the status of land utilization in Germo urban district[J]. Journal of Qinghai University, 2005, 23(3):23-26.
|
| [22] |
格尔木市统计局. 2022年格尔木市国民经济与社会发展统计公报[EB/OL]. 2023(2023-03-15)[2024-01-12]. http://tjj.qinghai.gov.cn/tjData/cityBulletin/202401/t20240112_240688.html.
url: http://tjj.qinghai.gov.cn/tjData/cityBulletin/202401/t20240112_240688.html
|
| [22] |
Golmud City Bureau of Statistics. Statistical bulletin of the national economic and social development of Golmud City in 2022[EB/OL]. 2023(2023-03-15)[2024-01-12]. http://tjj.qinghai.gov.cn/tjData/cityBulletin/202401/t20240112_240688.html.
url: http://tjj.qinghai.gov.cn/tjData/cityBulletin/202401/t20240112_240688.html
|
| [23] |
海西州统计局. 海西州2022年国民经济和社会发展统计公报[EB/OL]. 2023(2023-07-05)[2024-01-12]. http://tjj.qinghai.gov.cn/tjData/cityBulletin/202401/t20240112_240936.html.
url: http://tjj.qinghai.gov.cn/tjData/cityBulletin/202401/t20240112_240936.html
|
| [23] |
Haixi Prefecture Bureau of Statistics. Statistical bulletin of the national economic and social development of Haixi Prefecture in 2022[EB/OL]. 2023(2023-07-05)[2024-01-12]. http://tjj.qinghai.gov.cn/tjData/cityBulletin/202401/t20240112_240936.html.
url: http://tjj.qinghai.gov.cn/tjData/cityBulletin/202401/t20240112_240936.html
|
| [24] |
徐新良, 刘纪远, 张树文, 等. 中国多时期土地利用土地覆被遥感监测数据集(CNLUCC)[EB/OL]. 中国科学院地理科学与资源研究所, 2018[2024-01-11]. https://www.resdc.cn/DOI/DOI.aspx?DOIID=54.
url: https://www.resdc.cn/DOI/DOI.aspx?DOIID=54
|
| [24] |
Xu X L, Liu J Y, Zhang S W, et al. Remote sensing dataset for land use and land cover monitoring over multiple periods in China(CNLUCC)[EB/OL]. Institute of Geographic Sciences and Resources,Chinese Academy of Sciences,China, 2018[2024-01-11]. https://www.resdc.cn/DOI/DOI.aspx?DOIID=54.
url: https://www.resdc.cn/DOI/DOI.aspx?DOIID=54
|
| [25] |
Peng S Z, Ding Y X, Liu W Z, et al. 1 km monthly temperature and precipitation dataset for China from 1901 to 2017[J]. Earth System Science Data, 2019, 11(4):1931-1946.
|
| [26] |
王秀兰, 包玉海. 土地利用动态变化研究方法探讨[J]. 地理科学进展, 1999, 18(1):81-87.
|
| [26] |
Wang X L, Bao Y H. Study on the methods of land use dynamic change research[J]. Progress in Geography, 1999, 18(1):81-87.
doi: 10.11820/dlkxjz.1999.01.012
|
| [27] |
徐岚, 赵羿. 利用马尔柯夫过程预测东陵区土地利用格局的变化[J]. 应用生态学报, 1993, 4(3):272-277.
|
| [27] |
Xu L, Zhao Y. Forecast of land use pattern change in Dongling District of Shenyang:An application of Markov process[J]. Chinese Journal of Applied Ecology, 1993, 4(3):272-277.
|
| [28] |
张强, 朱飙, 杨金虎, 等. 西北地区气候湿化趋势的新特征[J]. 科学通报, 2021, 66(28-29):3757-3771.
|
| [28] |
Zhang Q, Zhu B, Yang J H, et al. New characteristics about the climate humidification trend in Northwest China[J]. Chinese Science Bulletin, 2021, 66(28-29):3757-3771.
|
|
Viewed |
|
|
|
Full text
|
|
|
|
|
Abstract
|
|
|
|
|
Cited |
|
|
|
|
| |
Shared |
|
|
|
|
| |
Discussed |
|
|
|
|
 2025,
Vol. 37
2025,
Vol. 37