|
|
|
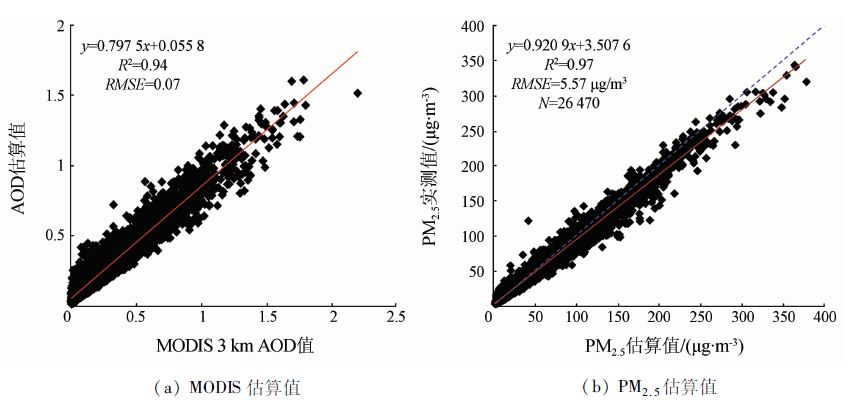
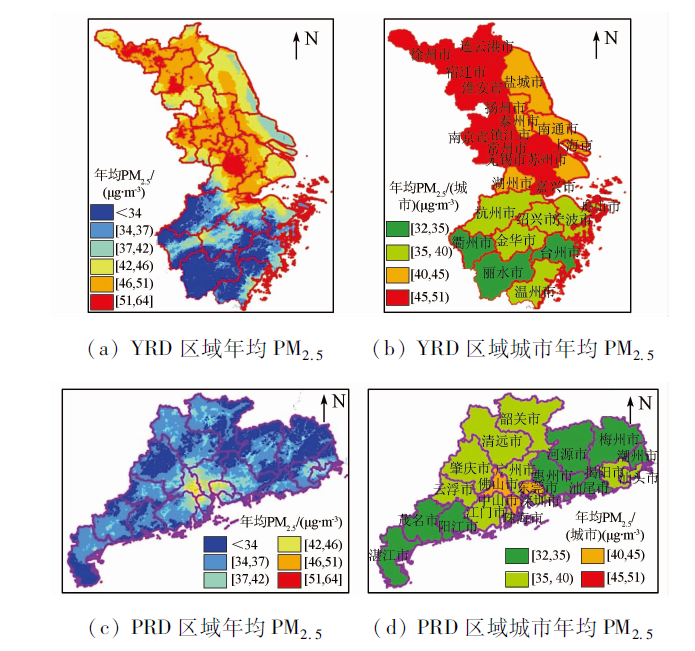
Abstract The aerosol optical depth (AOD) derived via dark-target algorithm has been widely used as an effective tool for estimating PM2.5concentrations. However, this algorithm cannot effectively retrieve AOD on the bright surface. Therefore, the authors used a random forest model incorporating meteorological parameters to predict the missing AOD values, and then employed a second-stage random forest model combining the retrieved AOD with meteorological parameters, vegetation cover and road density to estimate the PM2.5concentrations in two districts of eastern coastal zone of China, i.e., YRD and PRD. The result shows that the proposed model performed very well, achieving R2 of 0.94 for AOD predictions and MODIS AOD and an overall R2 of 0.97 with RMSE being only 5.57 μg/m 3 between the estimated and observed PM2.5 concentrations. The spatial distribution of PM2.5concentrations suggests that the high values are mainly located in Jiangsu Province with low elevation (≥40 μg/m3). The results indicate that the proposed two-stage random forest model incorporated with satellite AOD and other variables could be effectively used for estimating the ground-level PM2.5 concentrations.
|
| Keywords
random forest model
PM2.5 distribution
AOD retrieval
YRD
PRD
|
|
|
|
Issue Date: 23 December 2020
|
|
|
| [1] |
Ma J Z, Chen Y, Wang W, et al. Strong air pollution causes widespread haze-clouds over China[J]. Journal of Geophysical Research-Atmospheres, 2010,115(D18204).
|
| [2] |
Deng J J, Du K, Wang K, et al. Long-term atmospheric visibility trend in Southeast China,1973—2010[J]. Atmospheric Environment, 2012,59:11-21.
|
| [3] |
Fang X, Zou B, Liu X P, et al. Satellite-based ground PM2.5 estimation using timely structure adaptive modeling[J]. Remote Sensing of Environment, 2016,186:152-163.
|
| [4] |
陈辉, 厉青, 王中挺, 等. MERSI和MODIS卫星监测京津冀及周边地区PM2.5浓度[J]. 遥感学报, 2018,22(5):822-832.
|
| [4] |
Chen H, Li Q, Wang Z T, et al. Utilization of MERSI and MODIS data to monitor PM2.5 concentrations in Beijing-Tianjin-Hebei and its surrounding areas[J]. Journal of Remote Sensing, 2018,22(5):822-832.
|
| [5] |
Zhao P S, Zhang X L, Xu X F, et al. Long-term visibility trends and characteristics in the region of Beijing,Tianjin,and Hebei,China[J]. Atmospheric Research, 2011,101(3):711-718.
|
| [6] |
Cao J J, Shen Z X, Chow J C, et al. Winter and summer PM2.5 chemical compositions in fourteen Chinese cities[J]. Journal of the Air and Waste Management Association, 2012,62(10):1214-1226.
pmid: 23155868
url: https://www.ncbi.nlm.nih.gov/pubmed/23155868
|
| [7] |
Wang S, Li G G, Gong Z Y, et al. Spatial distribution,seasonal variation and regionalization of PM2.5 concentrations in China[J]. Science China-Chemistry, 2015,58(9):1435-1443.
|
| [8] |
Xu H, Guang J, Xue Y, et al. A consistent aerosol optical depth (AOD) dataset over mainland China by integration of several AOD products[J]. Atmospheric Environment, 2015,114:48-56.
|
| [9] |
van Donkelaar A, Martin R V, Park R J. Estimating ground-level PM2.5 using aerosol optical depth determined from satellite remote sensing[J]. Journal of Geophysical Research-Atmospheres, 2006,111(D21).
|
| [10] |
Fan X H, Chen H B, Lin L F, et al. Retrieval of aerosol optical properties over the Beijing area using POLDER/PARASOL satellite polarization measurements[J]. Advances in Atmospheric Sciences, 2009,26(6):1099-1107.
doi: 10.1007/s00376-009-8103-x
url: http://www.springerlink.com/content/9w31441h8n218414/
|
| [11] |
Livingston J M, Redemann J, Shinozuka Y, et al. Comparison of MODIS 3 km and 10 km resolution aerosol optical depth retrievals over land with airborne sunphotometer measurements during ARCTAS summer 2008[J]. Atmospheric Chemistry and Physics, 2014,14(4):2015-2038.
|
| [12] |
贾松林, 苏林, 陶金花, 等. 卫星遥感监测近地表细颗粒物多元回归方法研究[J]. 中国环境科学, 2014(3):565-573.
|
| [12] |
Jia S L, Su L, Tao J H, et al. A study of multiple regression method for estimating concentration of fine particulate matter using satellite remote sensing[J]. China Environmental Science, 2014(3):565-573.
|
| [13] |
Ma Z W, Liu Y, Zhao Q Y, et al. Satellite-derived high resolution PM2.5 concentrations in Yangtze River Delta region of China using improved linear mixed effects model[J]. Atmospheric Environment, 2016,133:156-164.
|
| [14] |
Gupta P, Christopher S A. Particulate matter air quality assessment using integrated surface,satellite,and meteorological products:2.A neural network approach[J]. Journal of Geophysical Research-Atmospheres, 2009,114.
doi: 10.1029/2008JE003285
pmid: 27630378
url: https://www.ncbi.nlm.nih.gov/pubmed/27630378
|
| [15] |
Wang Z F, Chen L F, Tao J H, et al. Satellite-based estimation of regional particulate matter (PM) in Beijing using vertical-and-RH correcting method[J]. Remote Sensing of Environment, 2010,114(1):50-63.
|
| [16] |
Yang X F, Zheng Y X, Geng G N, et al. Development of PM2.5 and NO2 models in a LUR framework incorporating satellite remote sensing and air quality model data in Pearl River Delta region,China[J]. Environmental Pollution, 2017,226:143-153.
pmid: 28419921
url: https://www.ncbi.nlm.nih.gov/pubmed/28419921
|
| [17] |
阳海鸥, 陈文波, 梁照凤. LUR模型模拟的南昌市PM2.5浓度与土地利用类型的关系[J]. 农业工程学报, 2017,33(6):232-239.
|
| [17] |
Yang H O, Chen W B, Liang Z F. Relationship of PM2.5 concentration and land use type in Nanchang City based on LUR simulation[J]. Transactions of the Chinese Society of Agricultural Engineering, 2017,33(6):232-239.
|
| [18] |
Zhang T H, Gong W, Wang W, et al. Ground level PM2.5 estimates over China using satellite-based geographically weighted regression (GWR) models are improved by including NO2 and enhanced vegetation index (EVI)[J]. International Journal of Environmental Research and Public Health, 2016,13(12):1215.
doi: 10.3390/ijerph13121215
url: http://www.mdpi.com/1660-4601/13/12/1215
|
| [19] |
Xiao L, Lang Y, Christakos G. High-resolution spatiotemporal mapping of PM2.5 concentrations at mainland China using a combined BME-GWR technique[J]. Atmospheric Environment, 2018,173:295-305.
|
| [20] |
Bai Y, Wu L X, Qin K, et al. A Geographically and temporally weighted regression model for ground-level PM2.5 estimation from satellite-derived 500 m resolution AOD[J]. Remote Sensing, 2016,8(3):262.
|
| [21] |
He Q Q, Huang B. Satellite-based mapping of daily high-resolution ground PM2.5 in China via space-time regression modeling[J]. Remote Sensing of Environment, 2018,206:72-83.
|
| [22] |
Lee H J, Liu Y, Coull B A, et al. A novel calibration approach of MODIS AOD data to predict PM2.5 concentrations[J]. Atmospheric Chemistry and Physics, 2011,11(15):7991-8002.
|
| [23] |
杨立娟, 徐涵秋, 金致凡. MODIS卫星遥感估计福州地区近地面PM2.5浓度[J]. 遥感学报, 2018,22(1):64-75.
|
| [23] |
Yang L J, Xu H Q, Jin Z F. Estimation of ground-level PM2.5 concentrations using MODIS satellite data in Fuzhou,China[J]. Journal of Remote Sensing, 2018,22(1):64-75.
|
| [24] |
Yang L J, Xu H Q, Jin Z F. Estimating ground-level PM2.5 over a coastal region of China using satellite AOD and a combined model[J]. Journal of Cleaner Production, 2019,227:472-482.
|
| [25] |
Sorek H M, Kloog I, Koutrakis P, et al. Assessment of PM2.5 concentrations over bright surfaces using MODIS satellite observations[J]. Remote Sensing of Environment, 2015,163:180-185.
doi: 10.1016/j.rse.2015.03.014
url: https://linkinghub.elsevier.com/retrieve/pii/S0034425715001108
|
| [26] |
Ma Z W, Hu X F, Huang L, et al. Estimating ground-level PM2.5 in China using satellite remote sensing[J]. Environmental Science and Technology, 2014,48(13):7436-7444.
pmid: 24901806
url: https://www.ncbi.nlm.nih.gov/pubmed/24901806
|
| [27] |
Mehdipour V, Stevenson D S, Memarianfard M, et al. Comparing different methods for statistical modeling of particulate matter in Tehran,Iran[J]. Air Quality Atmosphere and Health, 2018,11(10):1155-1165.
|
| [28] |
Hu X F, Belle J H, Meng X, et al. Estimating PM2.5 concentrations in the conterminous united states using the random forest approach[J]. Environmental Science and Technology, 2017,51(12):6936-6944.
pmid: 28534414
url: https://www.ncbi.nlm.nih.gov/pubmed/28534414
|
| [29] |
Brokamp C, Jandarov R, Hossain M, et al. Predicting daily urban fine particulate matter concentrations using a random forest model[J]. Environmental Science and Technology, 2018,52(7):4173-4179.
doi: 10.1021/acs.est.7b05381
pmid: 29537833
url: https://www.ncbi.nlm.nih.gov/pubmed/29537833
|
| [30] |
Song W Z, Jia H F, Huang J F, et al. A satellite-based geographically weighted regression model for regional PM2.5 estimation over the Pearl River Delta region in China[J]. Remote Sensing of Environment, 2014,154:1-7.
|
| [31] |
Breiman L. Random forests[J]. Machine Learning, 2001,45(1):5-32.
|
| [32] |
Khosravi I, Alavipanah S K. A random forest-based framework for crop mapping using temporal,spectral,textural and polarimetric observations[J]. International Journal of Remote Sensing, 2019,40(18):7221-7251.
|
| [33] |
Huang K Y, Xiao Q Y, Meng X, et al. Predicting monthly high-resolution PM2.5 concentrations with random forest model in the North China Plain[J]. Environmental Pollution, 2018,242:675-683.
doi: 10.1016/j.envpol.2018.07.016
pmid: 30025341
url: https://www.ncbi.nlm.nih.gov/pubmed/30025341
|
| [34] |
谢志英, 刘浩, 唐新明. 北京市MODIS气溶胶光学厚度与PM10质量浓度的相关性分析[J]. 环境科学学报, 2015(10):3292-3299.
|
| [34] |
Xie Z Y, Liu H, Tang X M. Correlation analysis between MODIS aerosol optical depth and PM10 concentration over Beijing[J]. Acta Scientiae Circumstantiae, 2015(10):3292-3299.
|
|
Viewed |
|
|
|
Full text
|
|
|
|
|
Abstract
|
|
|
|
|
Cited |
|
|
|
|
| |
Shared |
|
|
|
|
| |
Discussed |
|
|
|
|
 2020,
Vol. 32
2020,
Vol. 32
 )
)