|
|
 |
|

|
|
|
Spatiotemporal response of wetland landscape to urban expansion in Phnom Penh, Cambodia determined based on remote sensing |
DONG Li1,2( ), AN Na3, SUN Genyun1,2, ZHANG Aizhu1,2(), JIAO Zhijun1,2, DING Sunjinyan1,2, GE Jie4 ), AN Na3, SUN Genyun1,2, ZHANG Aizhu1,2(), JIAO Zhijun1,2, DING Sunjinyan1,2, GE Jie4 |
1. College of Oceanography and Space Informatics, China University of Petroleum (East China), Qingdao 266580, China
2. Laboratory for Marine Mineral Resources, Qingdao National Laboratory for Marine Science and Technology, Qingdao 266237, China
3. China Aero Geophysical Survey and Remote Sensing Center for Natural Resources, Bejing 100083, China
4. Sichuan Institute of Land Science and Technology, Sichuan Center of Satellite Application Technology, Chengdu 610045, China |
|
|
|
|
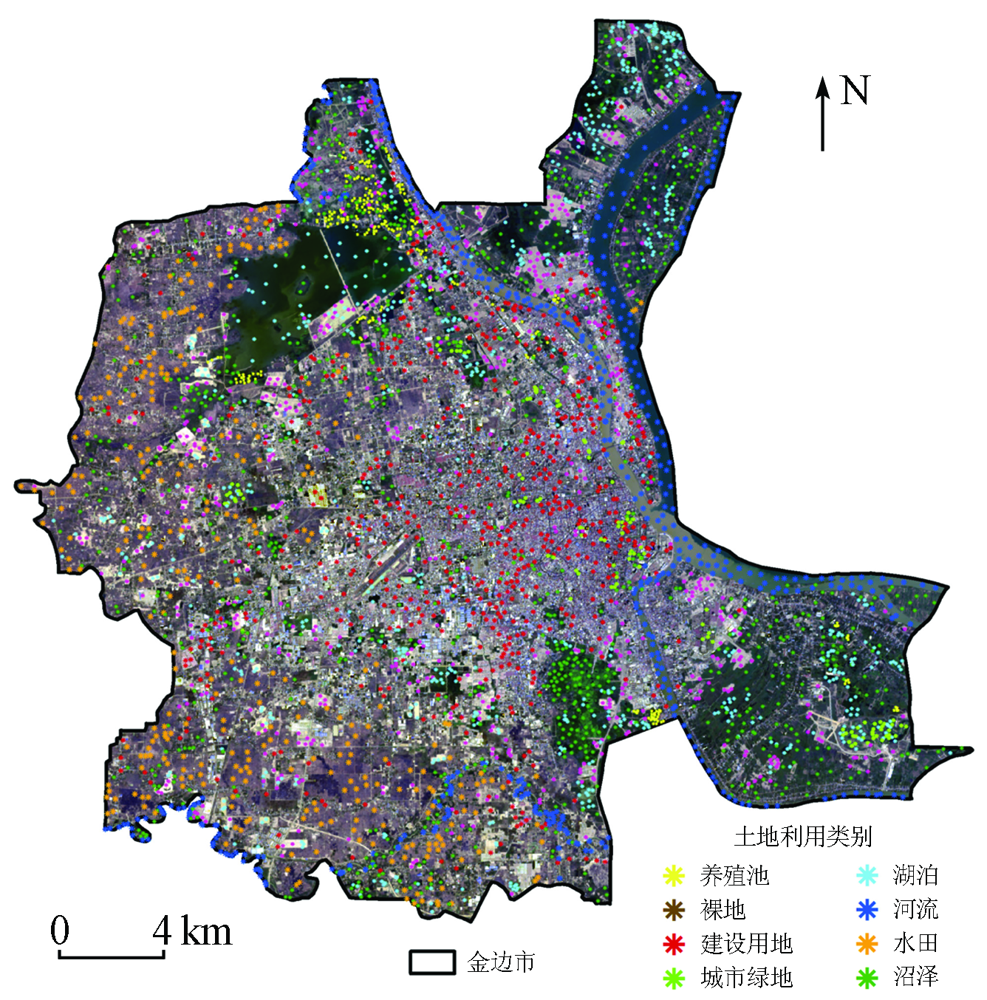
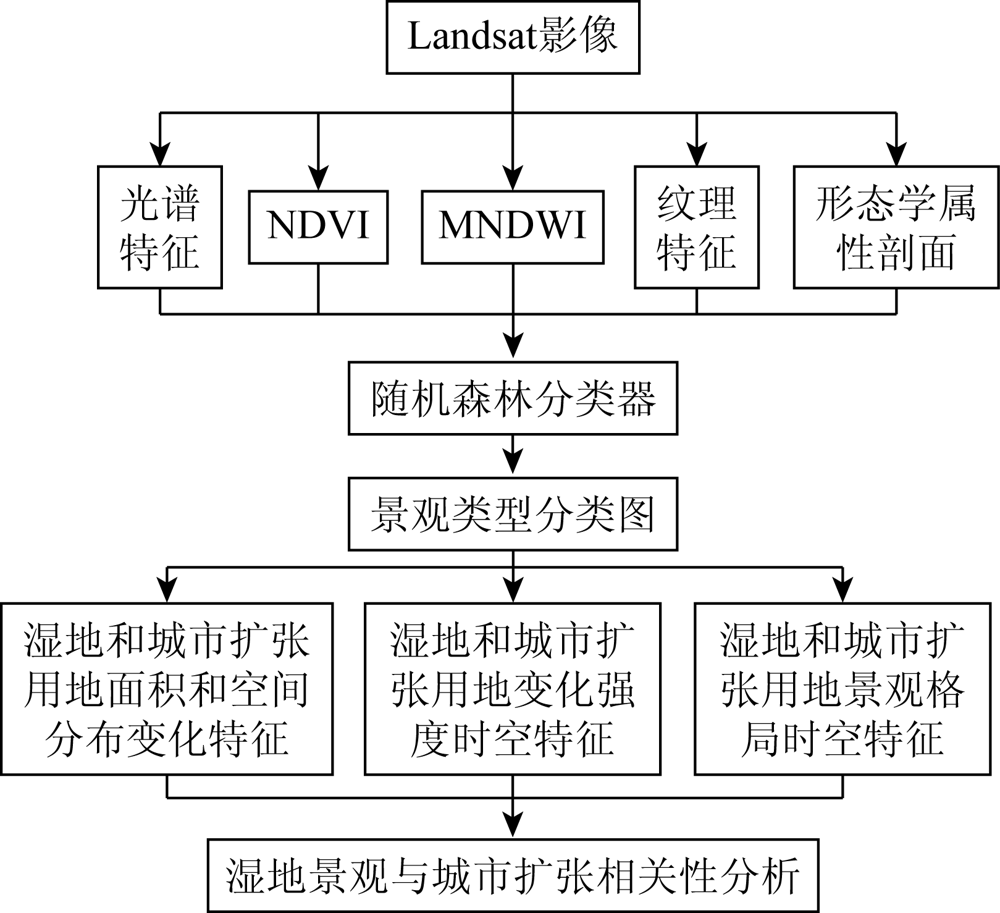
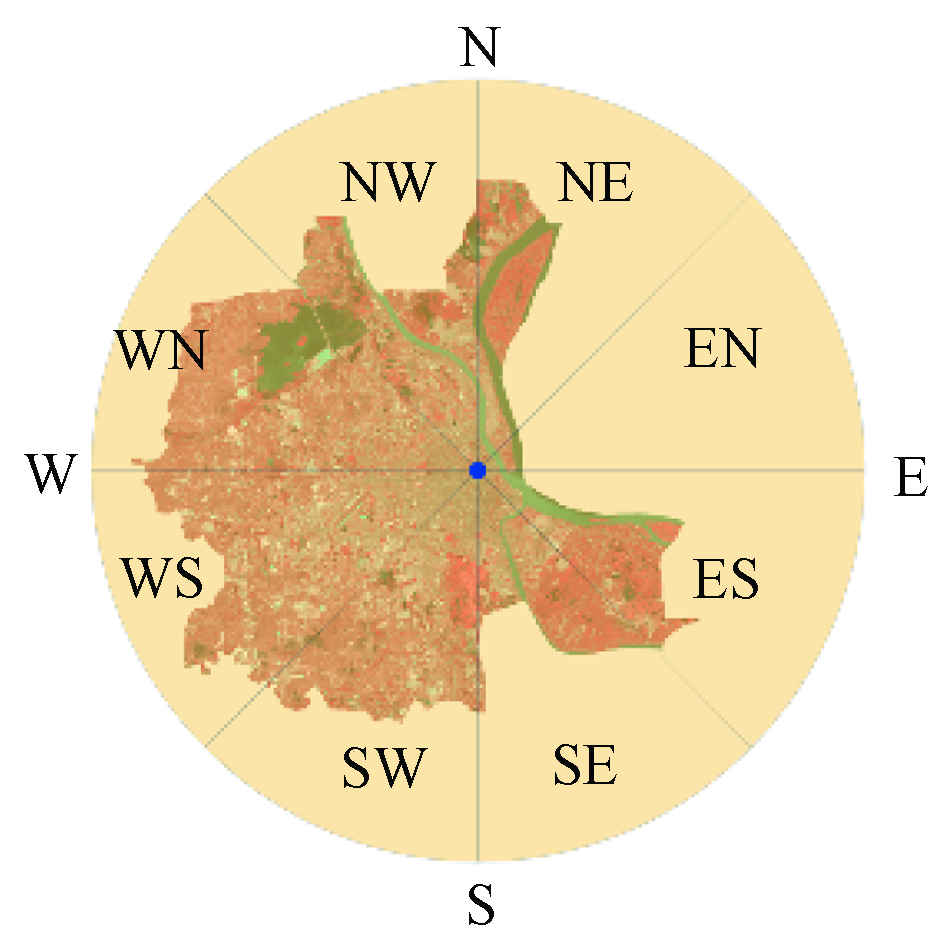
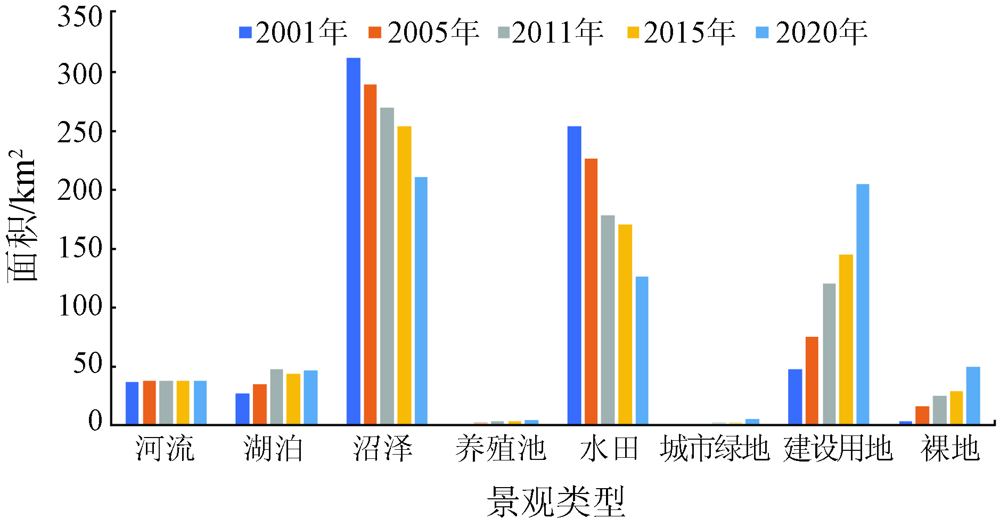
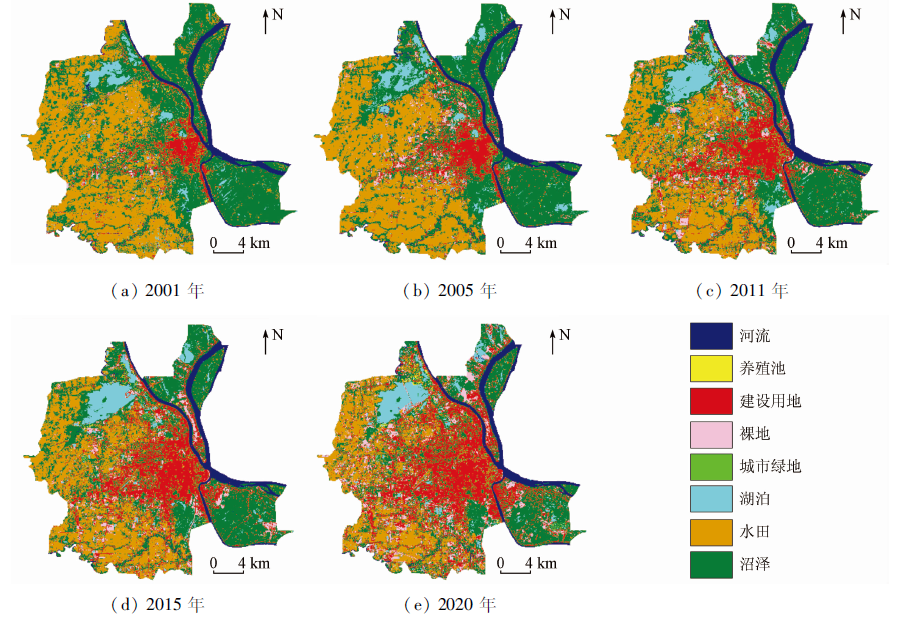
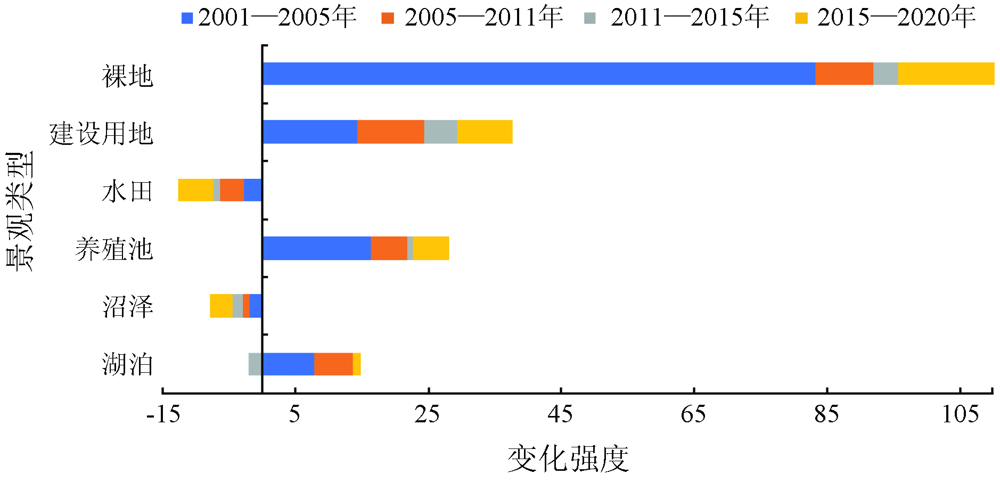
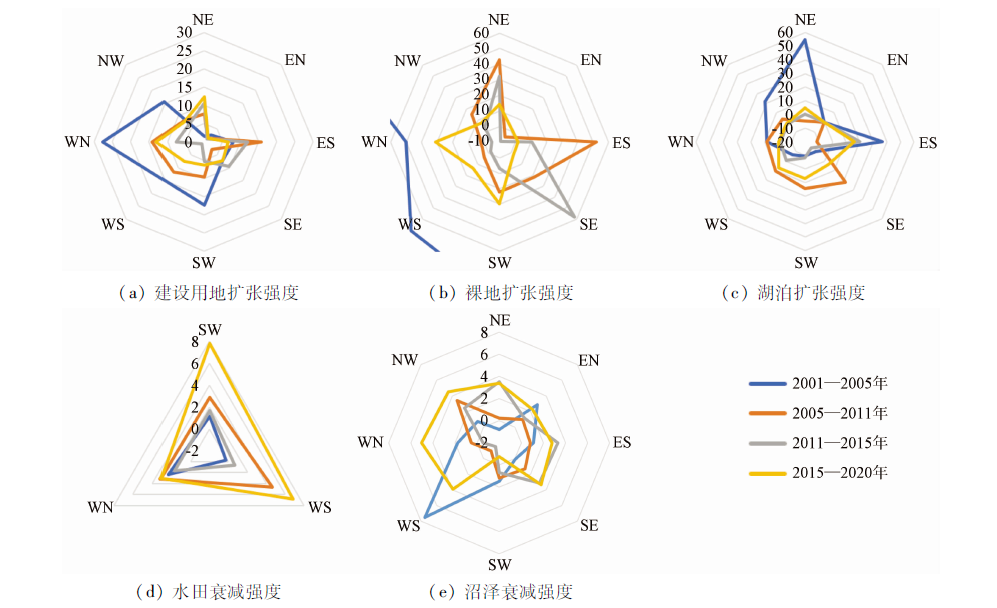
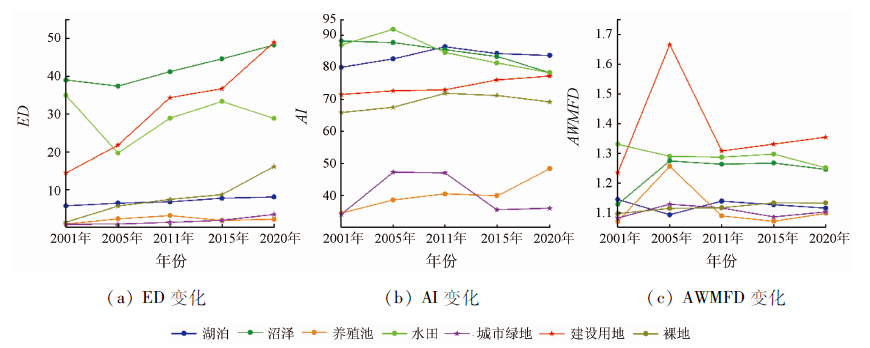
Abstract Phnom Penh is a typical city in the Lancang-Mekong River basin. It has rapidly developed and expanded under the Belt and Road Initiative and has continuously invaded its surrounding wetlands. To fully understand the response of the wetland landscape to the urban expansion in Phnom Penh, this study extracted the 2000—2020 land use data of this city from five phases of Landsat images, then analyzed the spatiotemporal characteristics of the changes in wetland landscapes and the land use for urban expansion from the aspects of area change, spatial distribution, change intensity, and landscape pattern, and finally established the quantitative relationships between the wetland landscape and the land use for urban expansion using the correlation coefficient. The results are as follows. The construction land and bare land in Phnom Penh had expanded outwards from the center, and their sizes had constantly increased during 2000—2020, especially during 2001—2005. Their spatial structures were increasingly concentrated, and the shapes were more complex. The wetland area continuously decreased, and the swamps and paddy fields were converted to construction land and bare land intensively. In particular, swamps with an area of 124.06 km2 were converted to construction land and bare land. In other words, about one-third of the swamps disappeared. The wetland landscape tended to be distributed in a fragmented and regularized manner. Its connectivity degree decreased and its ecological functions such as lowering the temperature, increasing the humidity, and regulating and storing floodwater were weakened. These changes in the wetland in Phnom Penh are significantly related to urban expansion, with a correlation coefficient in terms of area greater than 0.97 (p < 0.01). There is also a strong correlation between the intensity of the urban expansion and the wetland landscape pattern. To maintain the sustainable development of the city, it is necessary to reasonably plan the spatial layout in the process of urban expansion. The urban expansion should be conducted mainly through intensive development, paddy fields should be utilized first if necessary, and the occupation and destruction of swamps and wetlands should be avoided as much as possible.
|
| Keywords
wetland
urban expansion
landscape pattern
Phnom Penh, Cambodia
|
|
|
|
Corresponding Authors:
ZHANG Aizhu
E-mail: dxywy1020@126.com;zhangaizhu789@163.com
|
|
Issue Date: 21 September 2022
|
|
|
| [1] |
杨永兴. 国际湿地科学研究的主要特点、进展与展望[J]. 地理科学进展, 2002, 21(2):111-120.
|
| [1] |
Yang Y X. Main characteristics,progress and prospect of international wetland science research[J]. Progress in Geography, 2002, 21(2):111-120.
|
| [2] |
张月, 张飞, 王娟, 等. 近40年艾比湖湿地自然保护区生态干扰度时空动态及景观格局变化[J]. 生态学报, 2017, 37(21):7082-7097.
|
| [2] |
Zhang Y, Zhang F, Wang J, et al. Analysis of the temporal and spatial dynamics of landscape patterns and hemeroby index of the Ebinur Lake Wetland Nature Reserve,Xinjiang,over the last 40 years[J]. Acta Ecologica Sinica, 2017, 37(21):7082-7097.
|
| [3] |
Turner R K, van den Bergh J C J M, Söderqvist T, et al. Ecological-economic analysis of wetlands:Scientific integration for management and policy[J]. Ecological Economics, 2000, 35(1):7-23.
doi: 10.1016/S0921-8009(00)00164-6
url: https://linkinghub.elsevier.com/retrieve/pii/S0921800900001646
|
| [4] |
赵欣胜, 崔丽娟, 李伟, 等. 吉林省湿地调蓄洪水功能分析及其价值评估[J]. 水资源保护, 2016, 32(4):27-33,66.
|
| [4] |
Zhao X S, Cui L J, Li W, et al. Flood storage function analysis and value assessment of wetlands in Jilin Province[J]. Water Resources Protection, 2016, 32(4):27-33,66.
|
| [5] |
王延吉, 神祥金, 吕宪国. 1980—2015年东北沼泽湿地景观格局及气候变化特征[J]. 地球与环境, 2020, 48(3):348-357.
|
| [5] |
Wang Y J, Shen X J, Lyu X G. Change characteristics of landscape pattern and climate in marsh areas of northeast China during 1980—2015[J]. Earth and Environment, 2020, 48(3):348-357.
|
| [6] |
The UN Department of Economic and Social Affairs. 2018 of revision word urbanization prospects[R]. UN: New York, 2018.
|
| [7] |
谷雨, 闫敏, 李通, 等. 东南亚港口城市土地利用变化分析.遥感信息[J], 2021, 36(2):81-88.
|
| [7] |
Gu Y, Yan M, Li T, et al. Analysis of land use change in southeast Asian port cities[J]. Remote Sensing Information, 2021, 36(2):81-88.
|
| [8] |
海凯, 王思远, 马元旭, 等. “一带一路”沿线地区城市扩张和形态变化分析[J]. 地理学报, 2020, 75(10):2092-2108.
doi: 10.11821/dlxb202010005
|
| [8] |
Hai K, Wang S Y, Ma Y X, et al. Urban expansion and form changes along the Belt and Road Initiative[J]. Acta Geographica Sinica, 2020, 75(10):2092-2108.
|
| [9] |
禹丝思, 孙中昶, 郭华东, 等. 海上丝绸之路超大城市空间扩展遥感监测与分析[J]. 遥感学报, 2017, 21(2):169-181.
|
| [9] |
Yu S S, Sun Z C, Guo H D, et al. Monitoring and analyzing the spatial dynamics and patterns of megacities along the Maritime Silk Road[J]. Journal of Remote Sensing, 2017, 21(2):169-181.
|
| [10] |
韩瑞丹, 张丽, 郑艺, 等. 曼谷城市扩张生态环境效应[J]. 生态学报, 2017, 37(19):6322-6334.
|
| [10] |
Han R D, Zhang L, Zheng Y, et al. Urban expansion and its ecological environmental effects in Bangkok,Thailand[J]. Acta Ecologica Sinica, 2017, 37(19):6322-6334.
|
| [11] |
石小倩, 赵筱青, Jakariya M D, 等. 1980—2017年孟加拉国城市扩张的景观格局变化特征及其模式[J]. 水土保持通报, 2021, 41(2):275-283.
|
| [11] |
Shi X Q, Zhao X Q, Jakariya M D, et al. Characteristics and models of landscape pattern changes in urban expansion in Bangladesh during 1980—2017[J]. Bulletin of Soil and Water Conservation, 2021, 41(2):275-283.
|
| [12] |
柳钦火, 吴俊君, 李丽, 等. “一带一路”区域可持续发展生态环境遥感监测[J]. 遥感学报, 2018, 22(4):686-708.
|
| [12] |
Liu Q H, Wu J J, Li L, et al. Ecological environment monitoring for sustainable development goals in the Belt and Road region[J]. Journal of Remote Sensing, 2018, 22(4):686-708.
|
| [13] |
刘秋皇. 柬埔寨城市化发展战略研究[D]. 南京: 东南大学, 2016.
|
| [13] |
Liu Q H. Research on the urbanization development strategy of Cambodia[D]. Nanjing: Southeast University, 2016.
|
| [14] |
Mulder V L, Bruin S, Schaepman M E, et al. The use of remote sensing in soil and terrain mapping:A review[J]. Geoderma, 2010, 162(1-2):1-19.
doi: 10.1016/j.geoderma.2010.12.018
url: https://linkinghub.elsevier.com/retrieve/pii/S0016706110003976
|
| [15] |
梁铭哲. 1990—2018年京津冀城市群滨海湿地演变规律与利用程度评估[D]. 北京: 北京林业大学, 2020.
|
| [15] |
Liang M Z. Evolution rule and utilization assessment of coastal wetland in Beijing-Tianjin-Hebei urban agglomeration during 1990—2018[D]. Beijing: Beijing Forestry University, 2020.
|
| [16] |
张蔷, 鹿海峰, 赵文慧, 等. 2016—2018年北京城市湿地遥感监测分析[J]. 环境监控与预警, 2019, 11(5):91-95.
|
| [16] |
Zhang Q, Lu H F, Zhao W H, et al. Remote sensing monitoring and analysis of urban wetland in Beijing from 2016 to 2018[J]. Environmental Monitoring and Forewarning, 2019, 11(5):91-95.
|
| [17] |
张树苗, 白加德, 李夷平, 等. 城市化进程下北京市湿地面积变化研究[J]. 湿地科学, 2018, 16(1):30-32.
|
| [17] |
Zhang S M, Bai J D, Li Y P, et al. Change of wetlands’ area in Beijing under urbanization process[J]. Wetland Science, 2018, 16(1):30-32.
|
| [18] |
鞠永婧. 多尺度下快速城市化与湿地变化关系研究—以长三角城市群为例[D]. 上海: 华东师范大学, 2015.
|
| [18] |
Ju Y J. Exploring the relationship between rapid urbanization and wetland change:A case study of Yangtze River Delta[D]. Shanghai: East China Normal University, 2015.
|
| [19] |
Mao D H, Wang Z M, Wu J G, et al. China’s wetlands loss to urban expansion[J]. Land Degradation and Development, 2018, 29(8):2644-2657.
doi: 10.1002/ldr.2939
url: https://onlinelibrary.wiley.com/doi/10.1002/ldr.2939
|
| [20] |
娄艺涵, 张力小, 潘骁骏, 等. 1984年以来8个时期杭州主城区西部湿地格局研究[J]. 湿地科学, 2021, 19(2):247-254.
|
| [20] |
Lou Y H, Zhang L X, Pan X J, et al. Pattern of wetlands in the west of main city zone of Hangzhou for 8 periods since 1984[J]. Wetland Science, 2021, 19(2):247-254.
|
| [21] |
Basu T, Das A, Pham Q B, et al. Development of an integrated peri-urban wetland degradation assessment approach for the Chatra Wetland in eastern India[J]. Scientific Reports, 2021, 11:4470.
doi: 10.1038/s41598-021-83512-6
url: https://doi.org/10.1038/s41598-021-83512-6
|
| [22] |
吴思佳, 林金煌, 陈文惠, 等. 2000年以来4个时期闽三角城市群中的湿地格局及变化[J]. 湿地科学, 2018, 16(6):717-722.
|
| [22] |
Wu S J, Lin J H, Chen W H, et al. Patterns and changes of wetlands in the urban agglomeration of Min Delta in 2000,2005,2010 and 2015[J]. Wetland Science, 2018, 16(6):717-722.
|
| [23] |
宫兆宁, 张翼然, 宫辉力, 等. 北京湿地景观格局演变特征与驱动机制分析[J]. 地理学报, 2011, 66(1):77-88.
|
| [23] |
Gong Z N, Zhang Y R, Gong H L, et al. Evolution of wetland landscape pattern and its driving factors in Beijing[J]. Acta Geographica Sinica, 2011, 66(1):77-88.
|
| [24] |
李婧贤, 王钧, 杜依杭, 等. 快速城市化背景下珠江三角洲滨海湿地变化特征[J]. 湿地科学, 2019, 17(3):267-276.
|
| [24] |
Li J X, Wang J, Du Y H, et al. Change characteristics of coastal wetlands in the Pearl River Delta under rapid urbanization[J]. Wetland Science, 2019, 17(3):267-276.
|
| [25] |
谷雨. 海上丝绸之路沿线港口城市扩张和生态效益评价研究[D]. 泰安: 山东农业大学, 2020.
|
| [25] |
Gu Y. Research on port city expansion and ecological benefit evaluation along the Maritime Silk Road[D]. Taian: Shandong Agricultural University, 2020.
|
| [26] |
San V, Spoann V, Schmidt J. Industrial pollution load assessment in Phnom Penh,Cambodia using an industrial pollution projection system[J]. Science of the Total Environment, 2018, 615:990-999.
doi: 10.1016/j.scitotenv.2017.10.006
url: https://linkinghub.elsevier.com/retrieve/pii/S0048969717326931
|
| [27] |
Mialhe F, Gunnell Y, Navratil O, et al. Spatial growth of Phnom Penh,Cambodia (1973—2015):Patterns,rates,and socio-ecological consequences[J]. Land Use Policy, 2019, 87:104061.
doi: 10.1016/j.landusepol.2019.104061
url: https://linkinghub.elsevier.com/retrieve/pii/S0264837717316514
|
| [28] |
张磊, 宫兆宁, 王启为, 等. Sentinel-2影像多特征优选的黄河三角洲湿地信息提取[J]. 遥感学报, 2019, 23(2):313-326.
|
| [28] |
Zhang L, Gong Z N, Wang Q W, et al. Wetland mapping of Yellow River Delta wetlands based on multi-feature optimization of Sentinel-2 images[J]. Journal of Remote Sensing, 2019, 23(2):313-326.
|
| [29] |
王正兴, 刘闯, Huete A. 植被指数研究进展:从AVHRR-NDVI到MODIS-EVI[J]. 生态学报, 2003, 23(5):979-987.
|
| [29] |
Wang Z X, Liu C, Huete A. From AVHRR-NDVI to MODIS-EVI:Advances in vegetation index research[J]. Acta Ecologica Sinica, 2003, 23(5):979-987.
|
| [30] |
徐涵秋. 利用改进的归一化差异水体指数(MNDWI)提取水体信息的研究[J]. 遥感学报, 2005, 9(5):589-595.
|
| [30] |
Xu H Q. A study on information extraction of water body with the modified normalized difference water index (MNDWI)[J]. Journal of Remote Sensing, 2005, 9(5):589-595.
|
| [31] |
刘丽, 匡纲要. 图像纹理特征提取方法综述[J]. 中国图象图形学报, 2009, 14(4):622-635.
|
| [31] |
Liu L, Kuang G Y. Overview of image textural feature extraction methods[J]. Journal of Image and Graphics, 2009, 14(4):622-635.
|
| [32] |
Zhang A Z, Sun G Y, Ma P, et al. Coastal wetland mapping with Sentinel-2 MSI imagery based on gravitational optimized multilayer perceptron and morphological attribute profiles[J]. Remote Sensing, 2019, 11(8):952.
doi: 10.3390/rs11080952
url: https://www.mdpi.com/2072-4292/11/8/952
|
| [33] |
鲍蕊, 夏俊士, 薛朝辉, 等. 基于形态学属性剖面的高光谱影像集成分类[J]. 遥感技术与应用, 2016, 31(4):731-738.
|
| [33] |
Bao R, Xia J S, Xue Z H, et al. Ensemble classification for hyperspectral imagery based on morphological attribute profiles[J]. Remote Sensing Technology and Application, 2016, 31(4):731-738.
|
| [34] |
邬建国. 景观生态学——格局、过程、尺度与等级[M]. 北京: 高等教育出版社, 2007.
|
| [34] |
Wu J G. Landscape ecological:Pattern,process,scale and hierarchy[M]. Beijing: Higher Education Press, 2007.
|
| [35] |
谢苗苗, 王仰麟, 付梅臣. 城市地表温度热岛影响因素研究进展[J]. 地理科学进展, 2011, 30(1):35-41.
|
| [35] |
Xie M M, Wang Y L, Fu M C. An overview and perspective about causative factors of surface urban heat island effects[J]. Progress in Geography, 2011, 30(1):35-41.
|
| [36] |
黄硕, 郭青海. 城市景观格局演变的水环境效应研究综述[J]. 生态学报, 2014, 34(12):3142-3150.
|
| [36] |
Huang S, Guo Q H. Research review on effects of urban landscape pattern changes on water environment[J]. Acta Ecologica Sinica, 2014, 34(12):3142-3150.
|
| [37] |
王伟武, 胡沾沾, 徐婷立, 等. 城市湿地空间社会—生态韧性规划策略研究[C]// 中国城市规划学会.面向高质量发展的空间治理——2020中国城市规划年会论文集. 北京: 中国建筑工业出版社, 2021:218-231.
|
| [37] |
Wang W W, Hu Z Z, Xu T L, et al. Urban wetland spatial society-ecological resilience planning strategy research[C]// Urban Planning Society of China.Spatial governance for high-quality develo-pment:Proceedings of Annual National Planning Conference 2020. Beijing: China Architecture and Building Press, 2021:218-231.
|
| [38] |
Cao X, Onishi A, Chen J, et al. Quantifying the cool island intensity of urban parks using ASTER and IKONOS data[J]. Landscape and Urban Planning, 2010, 96(4):224-231.
doi: 10.1016/j.landurbplan.2010.03.008
url: https://linkinghub.elsevier.com/retrieve/pii/S016920461000054X
|
| [39] |
Chang C R, Li M H, Chang S D. A preliminary study on the local cool-island intensity of Taipei City parks[J]. Landscape and Urban Planning, 2006, 80(4):386-395.
doi: 10.1016/j.landurbplan.2006.09.005
url: https://linkinghub.elsevier.com/retrieve/pii/S0169204606002076
|
|
Viewed |
|
|
|
Full text
|
|
|
|
|
Abstract
|
|
|
|
|
Cited |
|
|
|
|
| |
Shared |
|
|
|
|
| |
Discussed |
|
|
|
|
 2022,
Vol. 34
2022,
Vol. 34