|
|
|
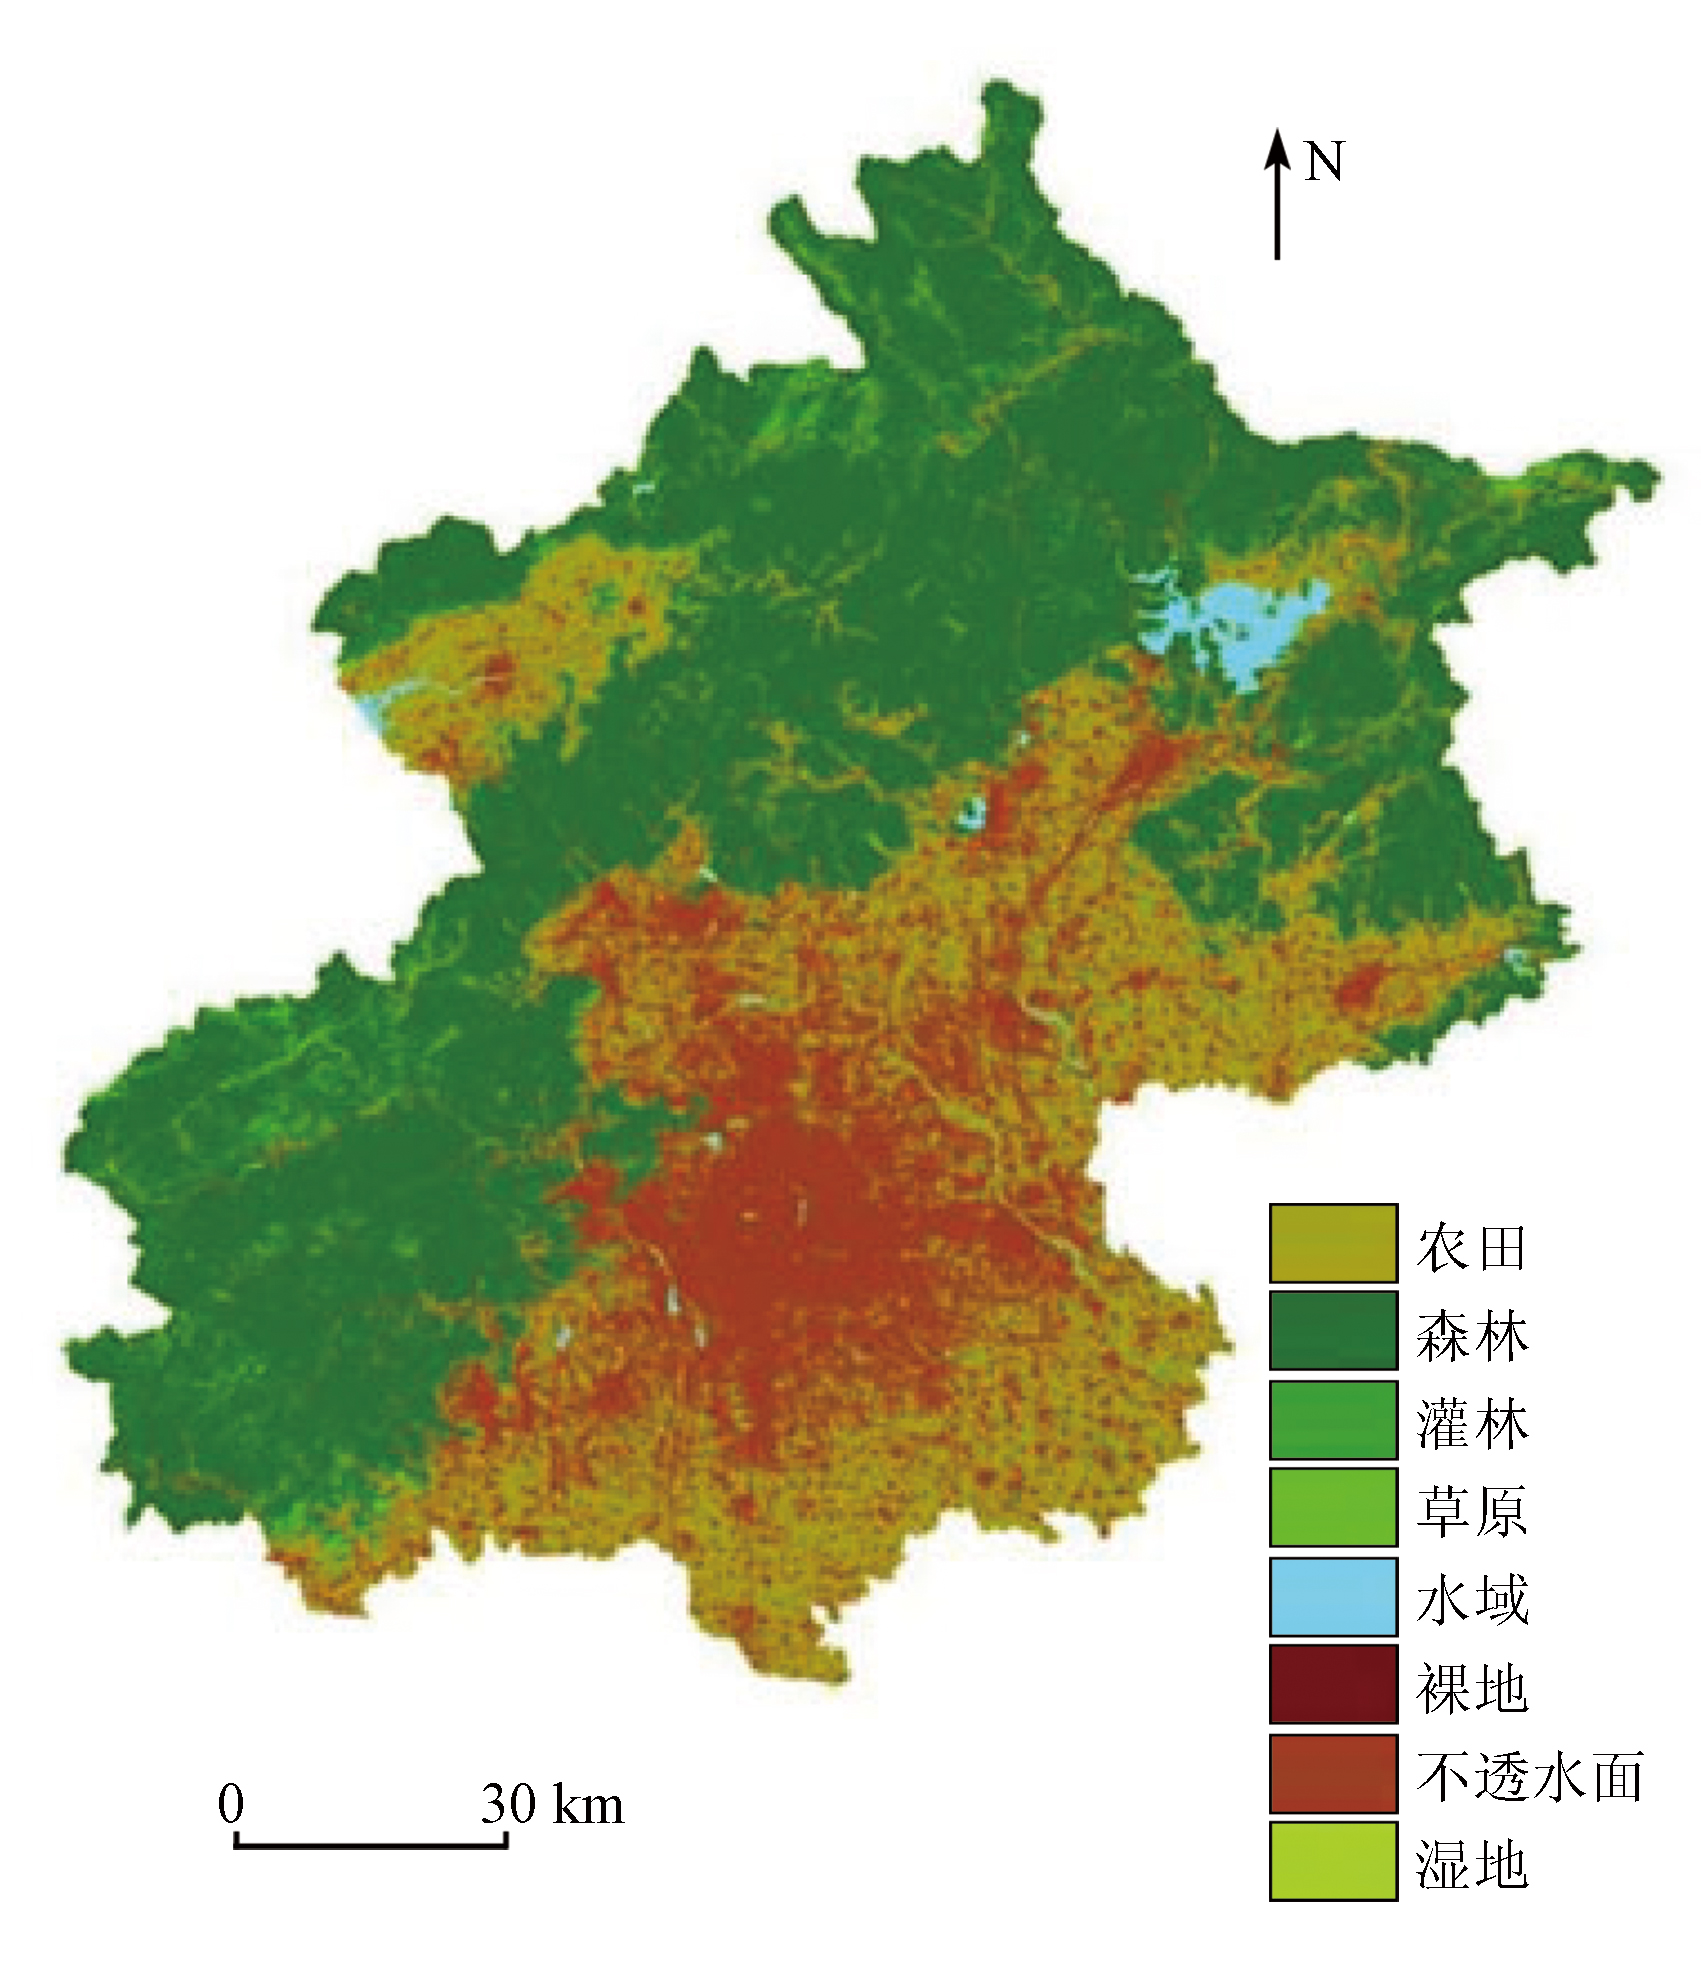
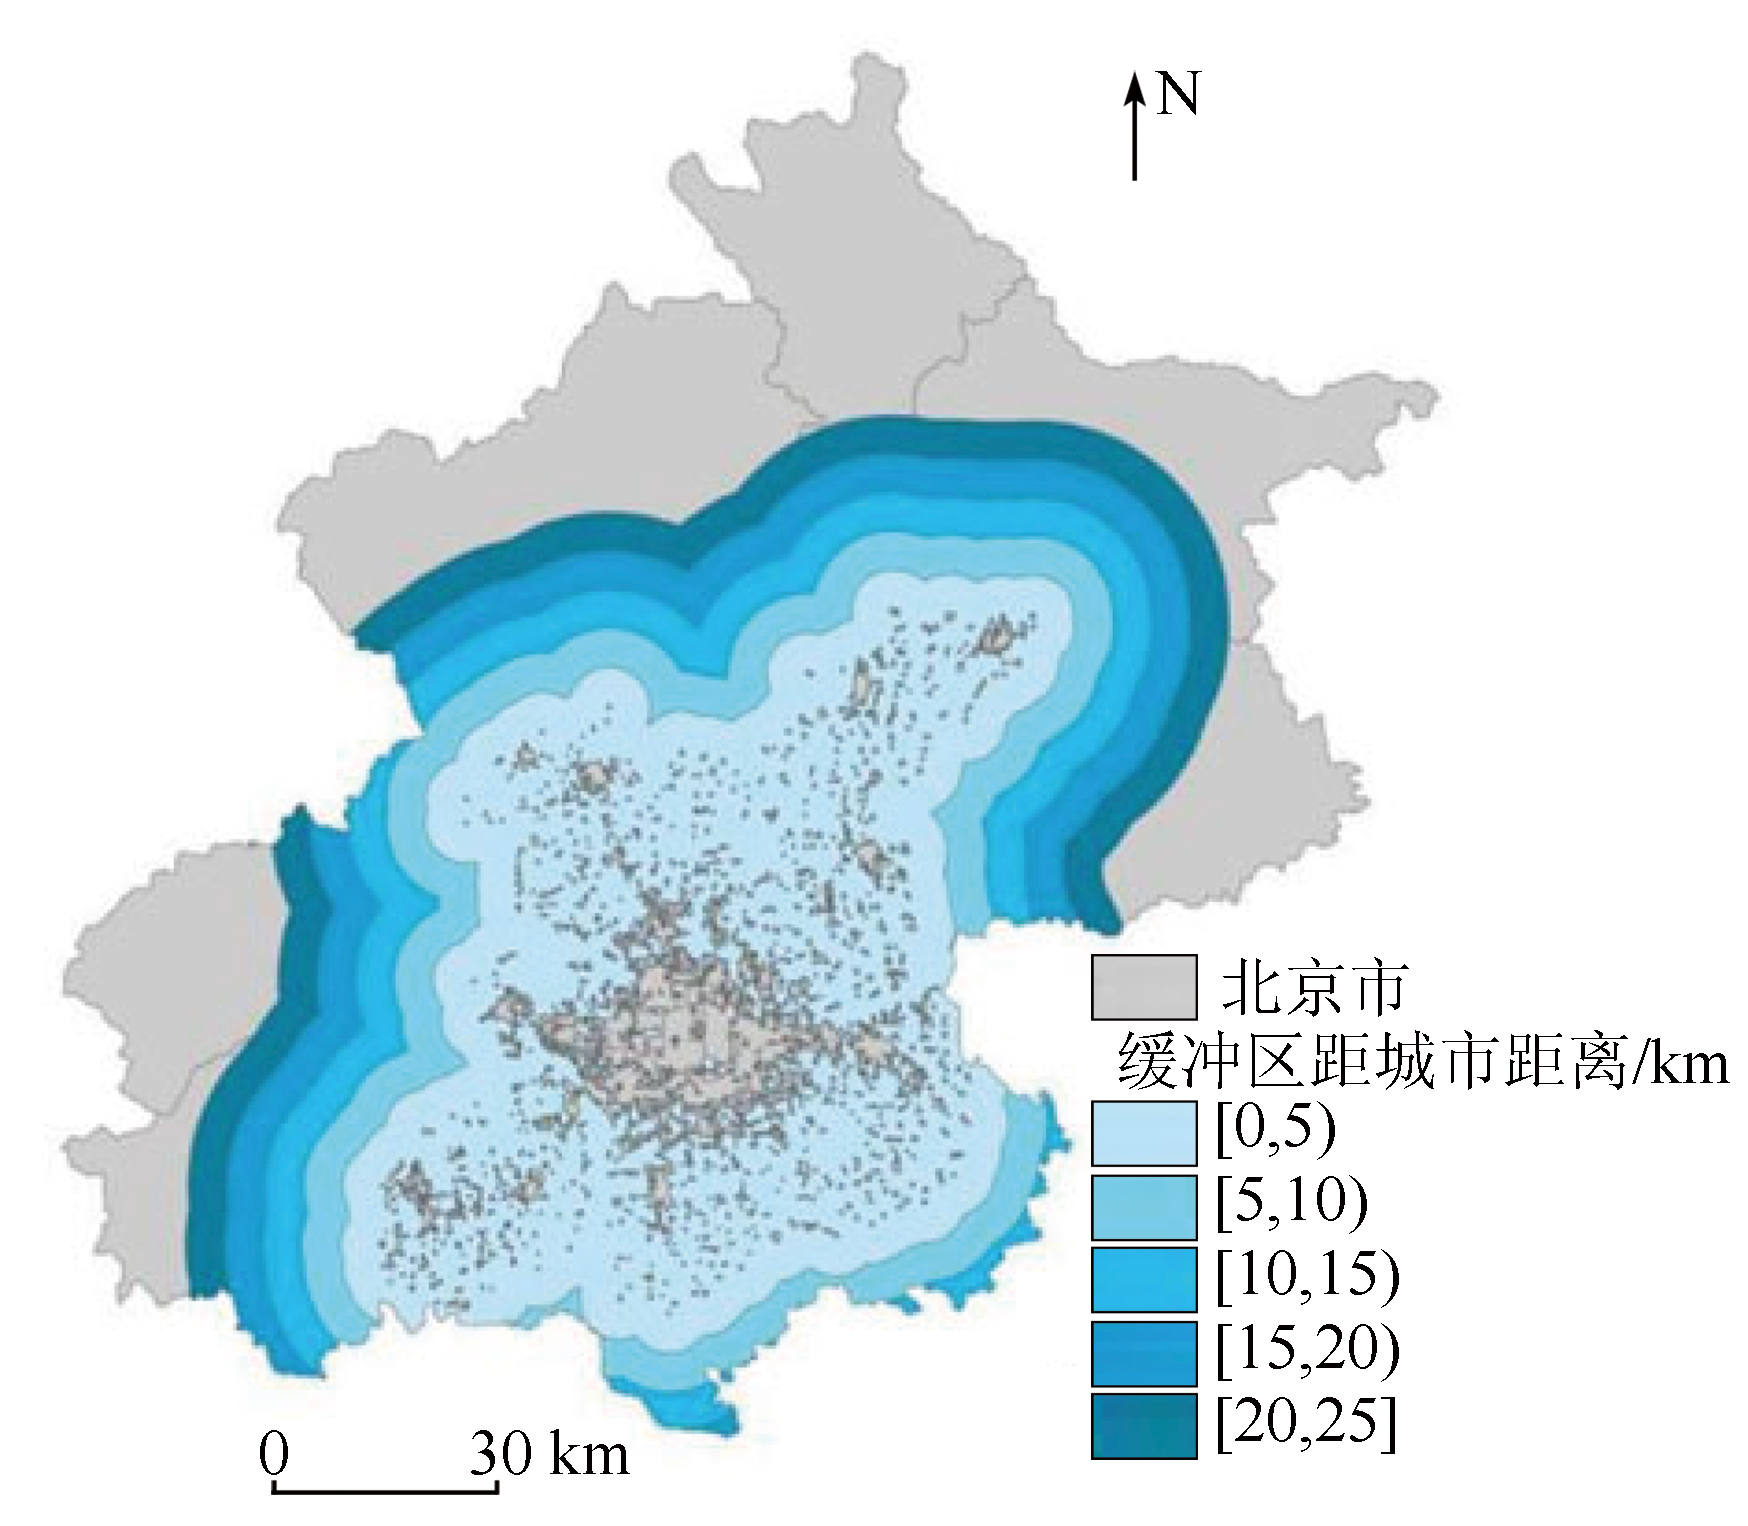
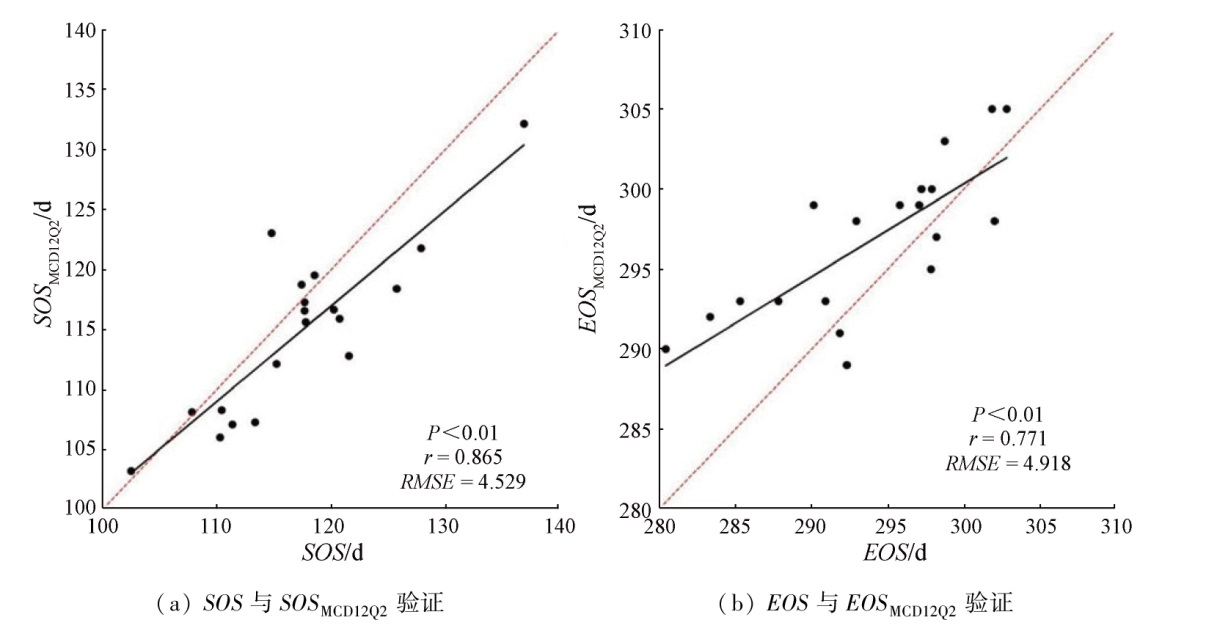
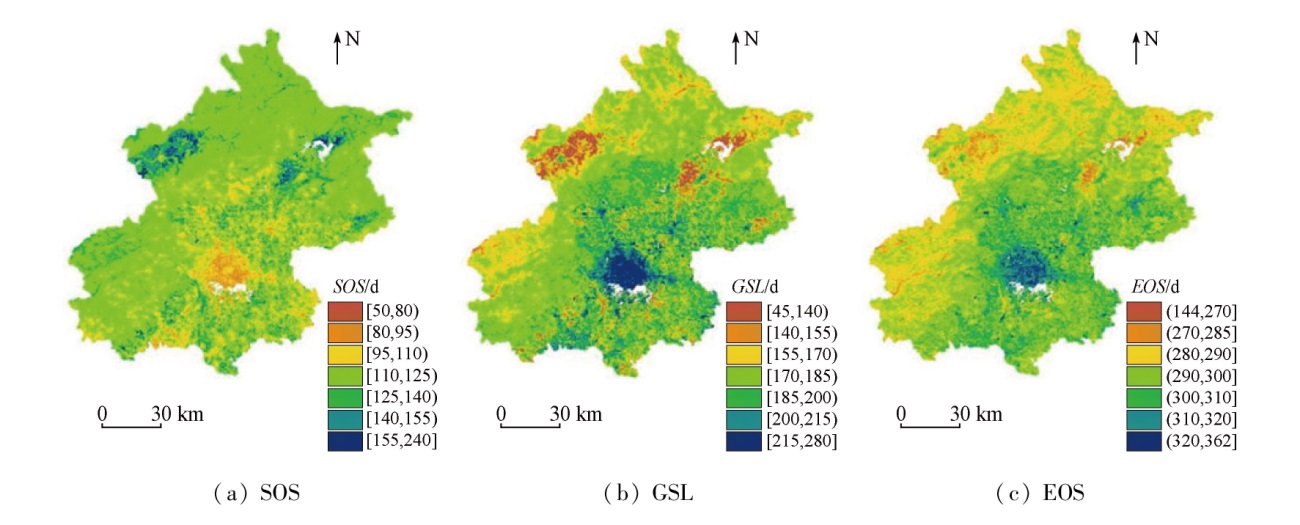
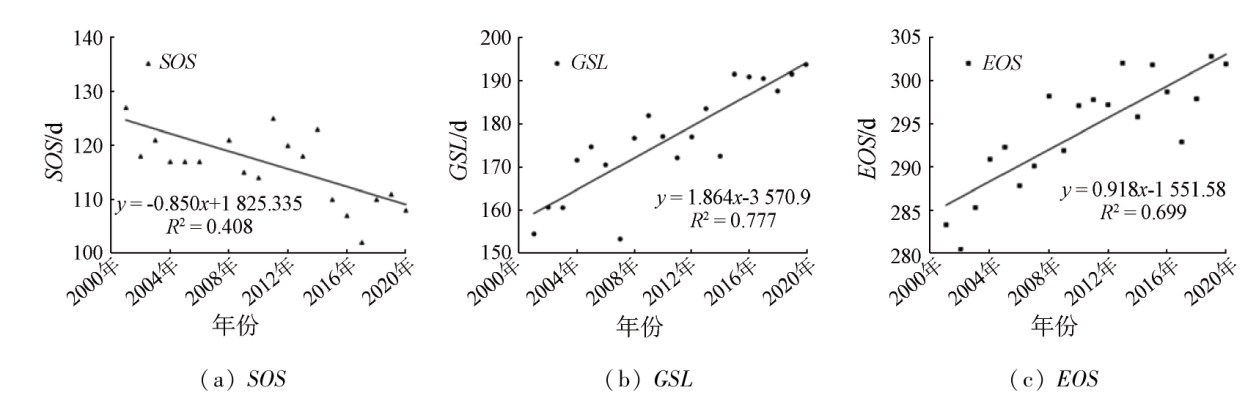
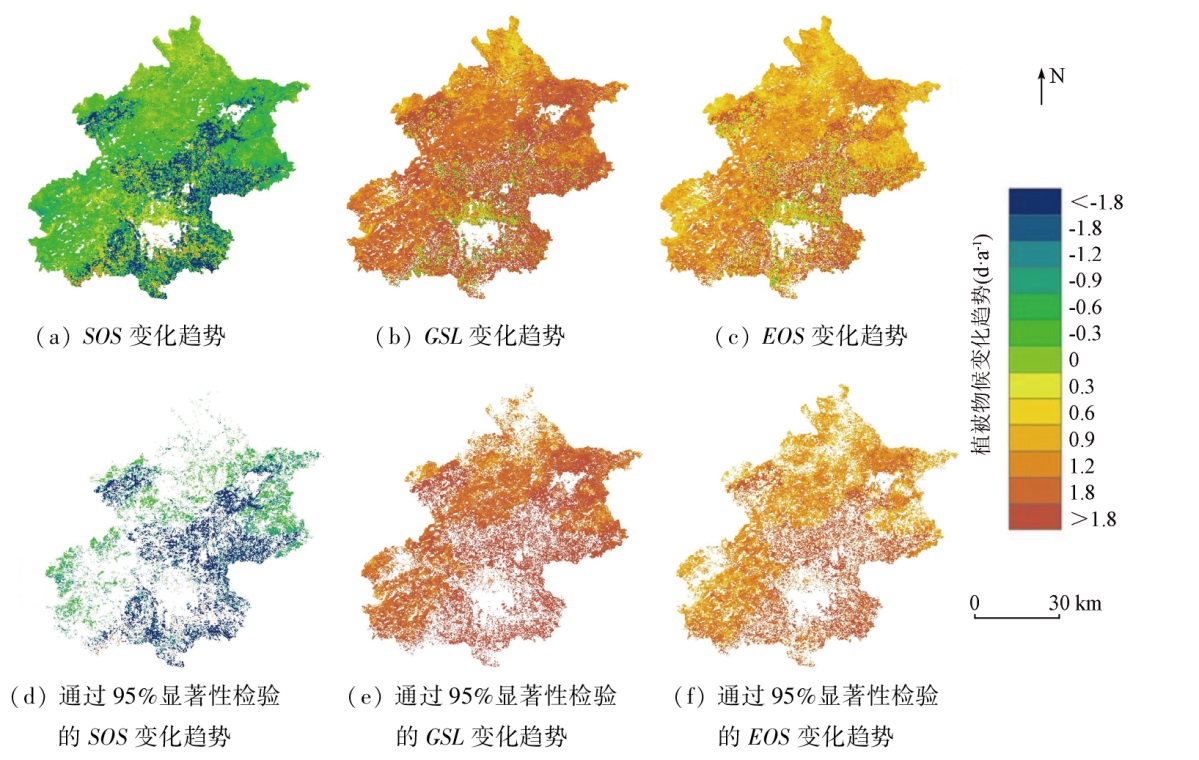
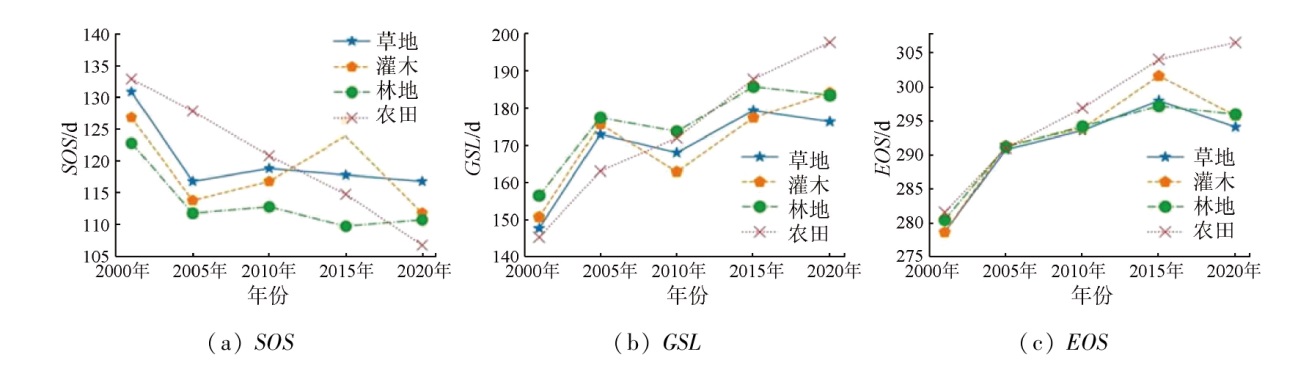
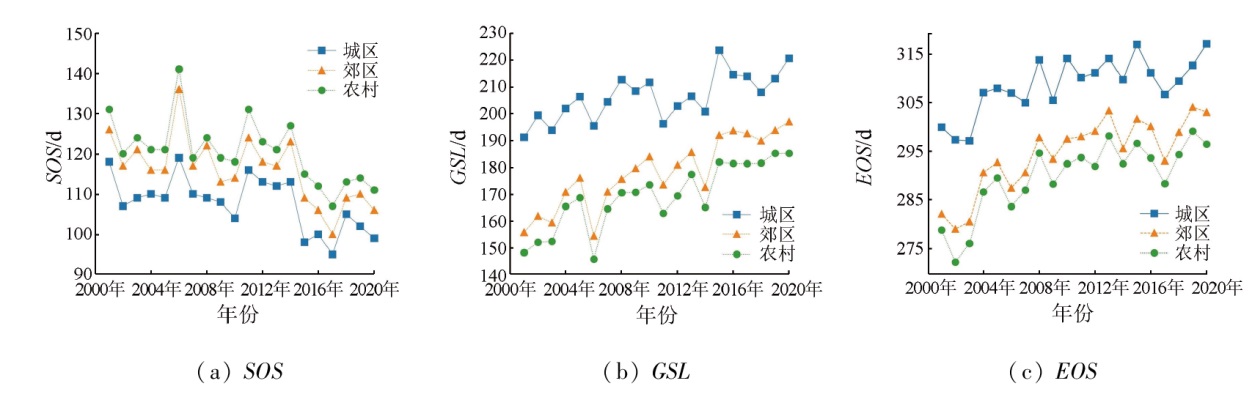
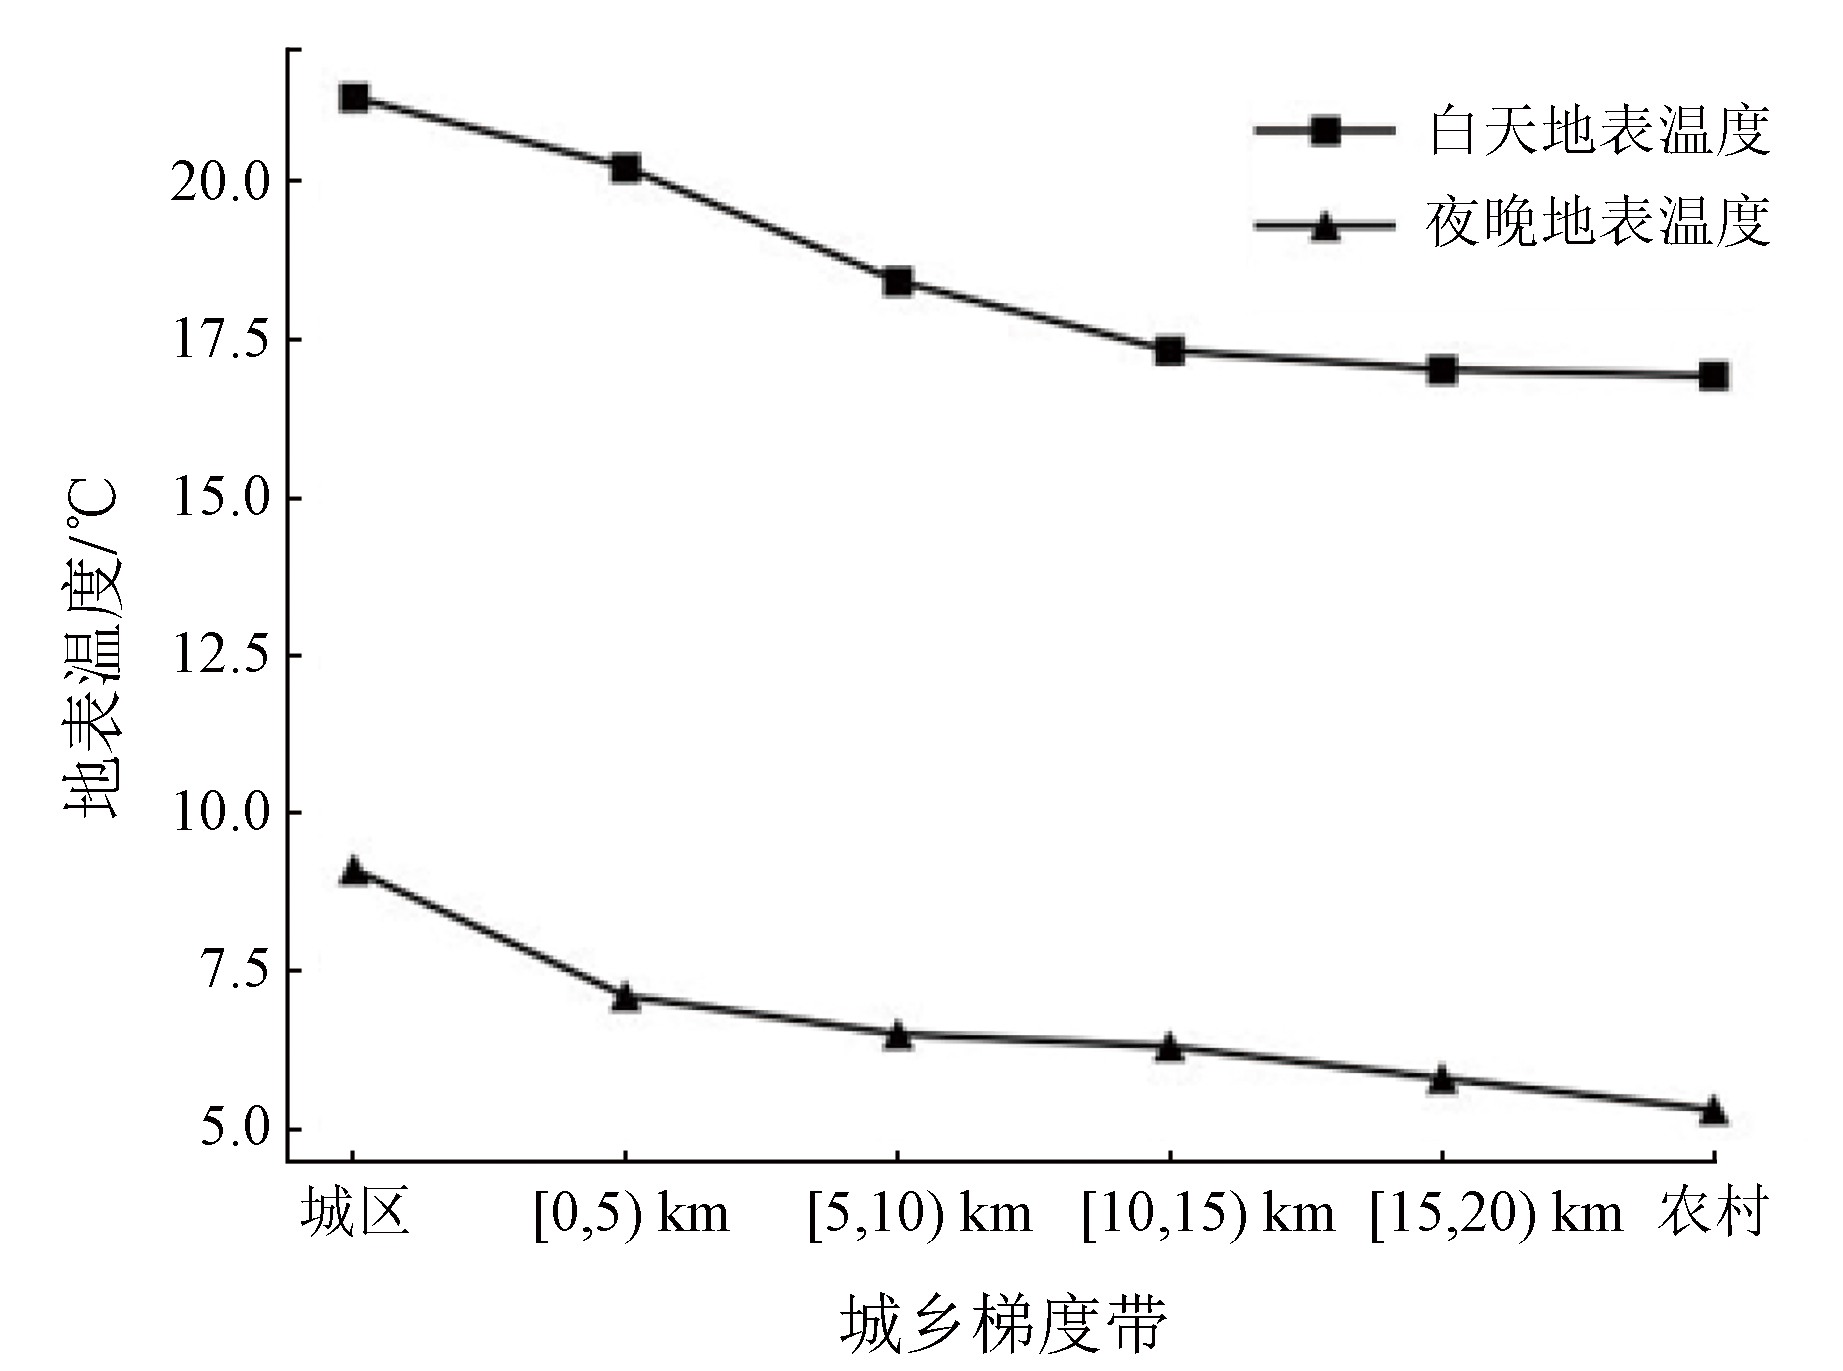
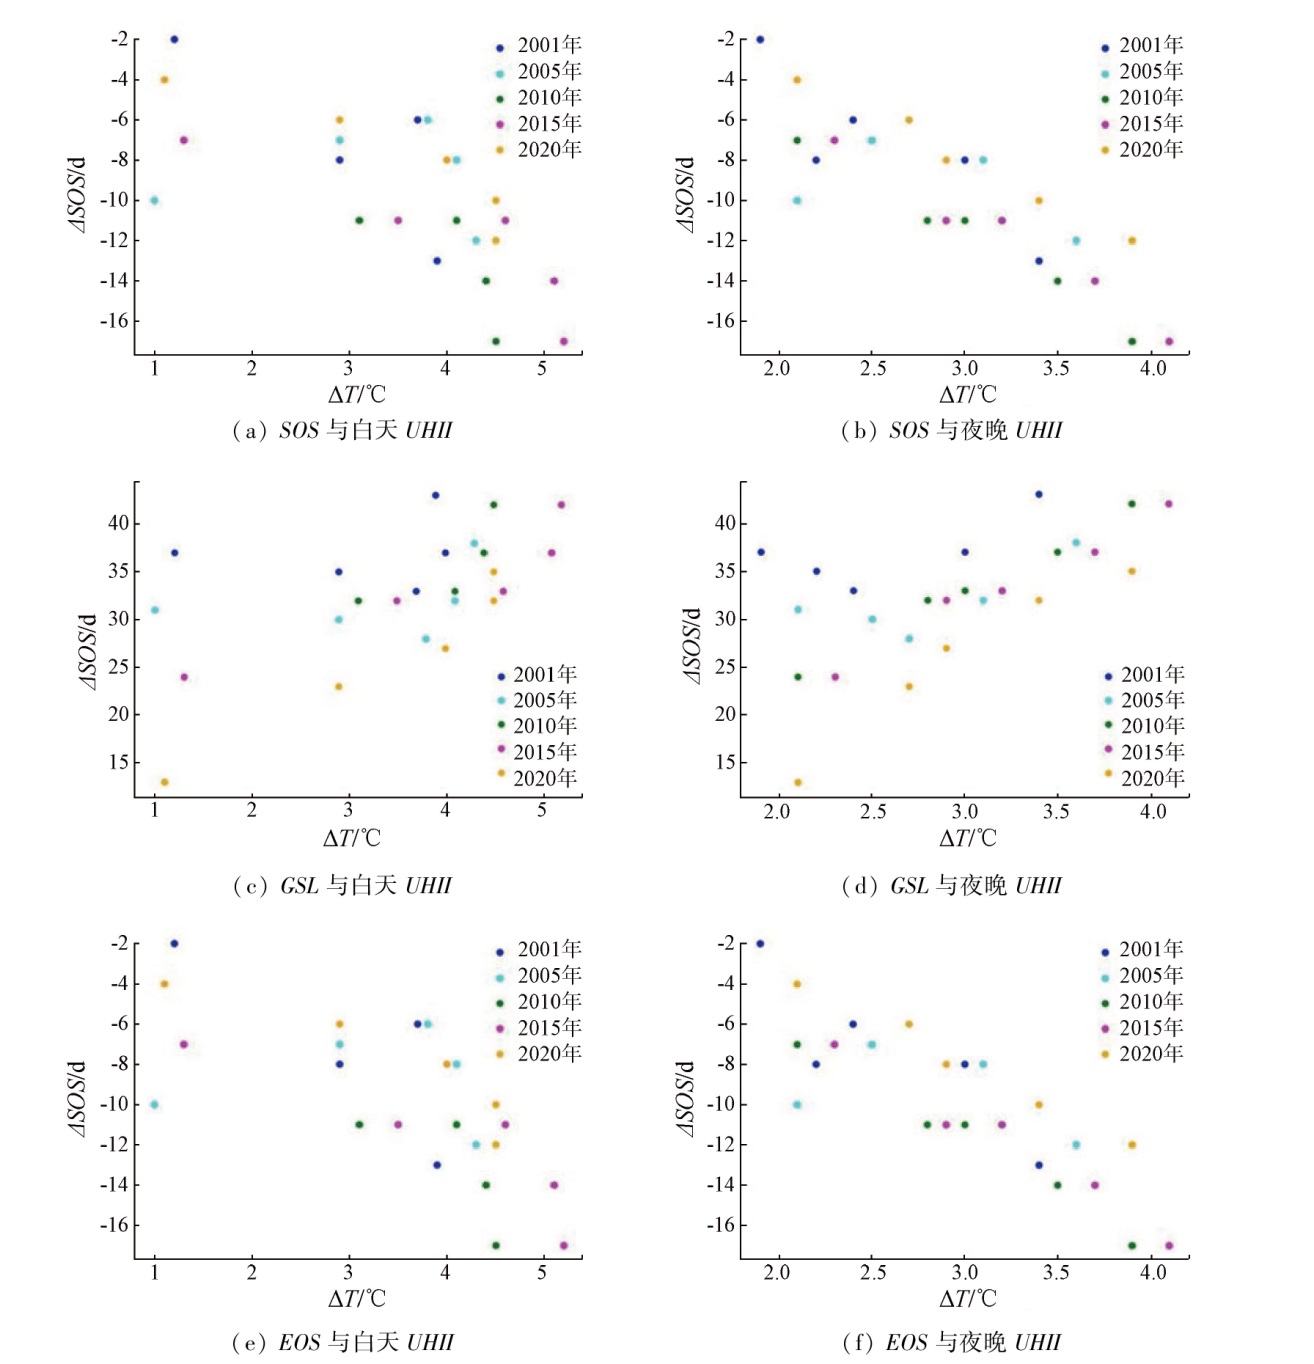
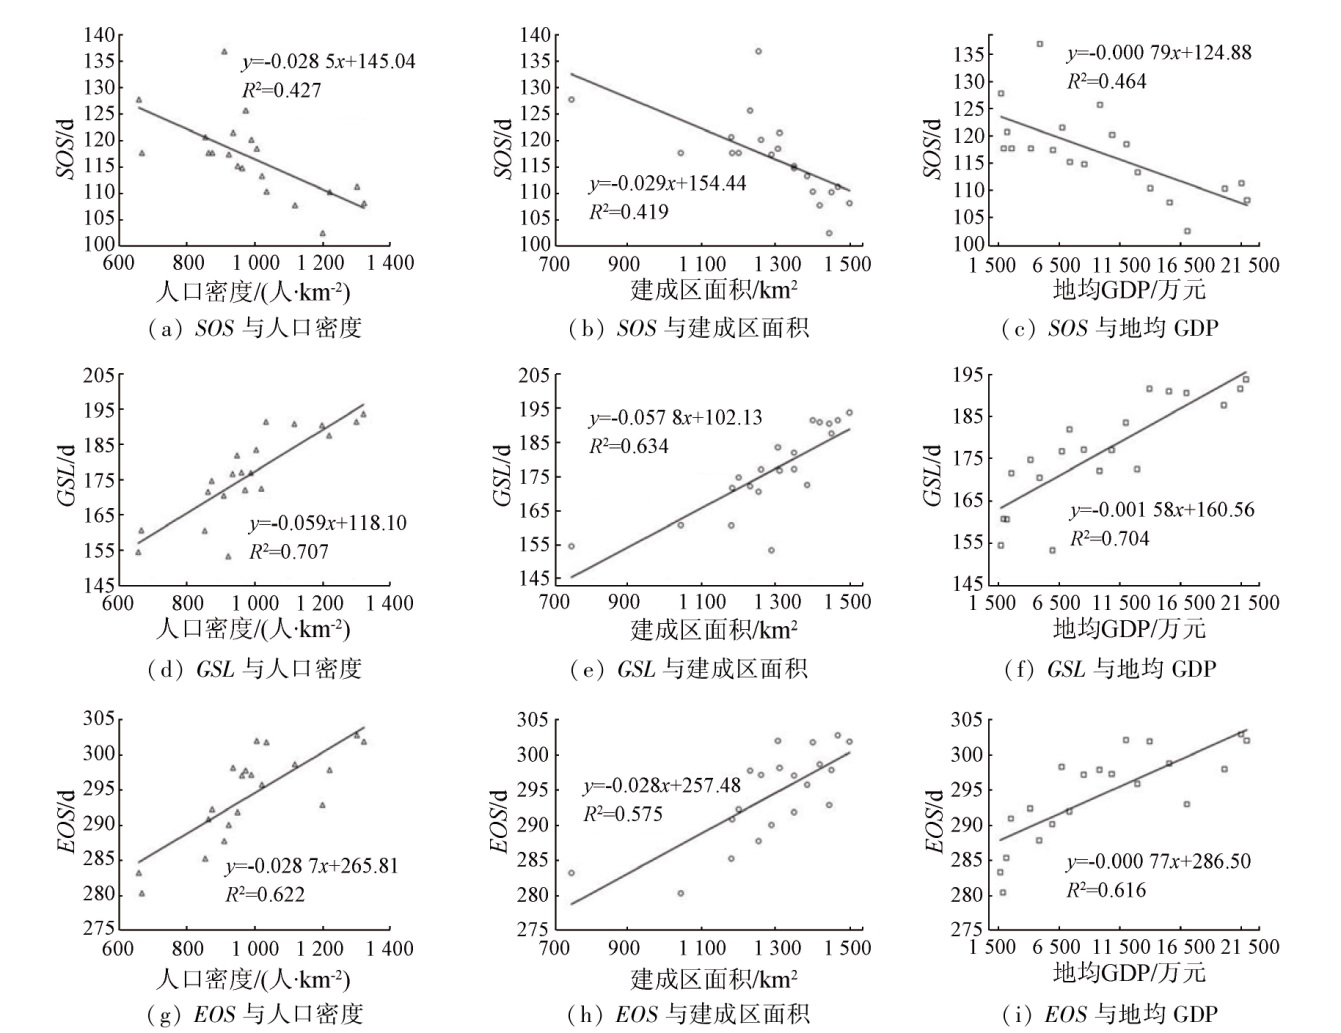
Abstract Vegetation can indicate the changes in ecological environments. Analyzing the spatio-temporal variations and influencing factors of vegetation phenology holds critical significance for exploring the carbon, water, and energy balance of terrestrial ecosystems. In this study, the MOD13Q1 EVI dataset was employed to extract the start of season (SOS), the growing season length (GSL), and the end of season (EOS) for vegetation in Beijing from 2001 to 2020 using the double logistic (D-L) function fitting method and the dynamic threshold method. The spatio-temporal variations of vegetation phenology in urban and rural areas of Beijing were analyzed by constructing an urban-rural gradient zone. The response of vegetation phenological parameters to climate factors like temperature, precipitation, sunshine, and wind speed, as well as urban heat island intensity and urbanization, was investigated through regression and trend analyses. The results show that from 2001 to 2020, the vegetation phenology of Beijing manifested a trend of earlier SOS, extended GSL, and delayed EOS. Compared to grassland, woodland and shrubs manifested earlier SOS and later EOS, suggesting that the phenology of woody plants started earlier and ended later. As revealed by the relationship between climate factors and phenology, temperature, precipitation, sunshine, and wind speed all displayed certain effects on vegetation phenology in Beijing, with SOS and EOS being the most sensitive to sunshine and wind speed, respectively. The vegetation phenology was characterized by a significant gradient change along the urban-suburban-rural direction. Compared to the rural area, the urban area showed SOS 12.2 d earlier and EOS 18.9 d later on average. The urban nighttime heat island intensity was significantly correlated with the SOS of vegetation in the urban-rural gradient zone (p<0.01). Moreover, the SOS, GSL, and EOS were significantly linearly correlated with population density, urban built-up area, and GDP per square kilometer of land (p<0.01). Therefore, urbanization played a significant role in advancing SOS, extending GSL, and delaying EOS of vegetation phenology in Beijing.
|
| Keywords
vegetation phenology
climate change
urbanization
urban heat island effect
|
|
|
|
Issue Date: 14 June 2024
|
|
|
| [1] |
曹沛雨, 张雷明, 李胜功, 等. 植被物候观测与指标提取方法研究进展[J]. 地球科学进展, 2016, 31(4):365-376.
doi: 10.11867/j.issn.1001-8166.2016.04.0365.
|
| [1] |
Cao P Y, Zhang L M, Li S G, et al. Review on vegetation phenology observation and phenological index extraction[J]. Advances in Earth Science, 2016, 31(4):365-376.
doi: 10.11867/j.issn.1001-8166.2016.04.0365.
|
| [2] |
付永硕, 李昕熹, 周轩成, 等. 全球变化背景下的植物物候模型研究进展与展望[J]. 中国科学:地球科学, 2020, 50(9):1206-1218.
|
| [2] |
Fu Y S, LI X X, Zhou X C, et al. Progress in plant phenology modeling under global climate change[J]. Scientia Sinica(Terrae), 2020, 63:1237-1247.
|
| [3] |
卜亚勤, 丁海勇. 北京植被物候时空变化及其对城市化的响应[J]. 遥感信息, 2022, 37(2):112-118.
|
| [3] |
Bu Y Q, Ding H Y. Spatiotemporal variation of vegetation phenology and its response to urbanization in Beijing[J]. Remote Sensing Information, 2022, 37(2):112-118.
|
| [4] |
李婷婷, 郭增长, 马超. 中国第二、三级阶梯地形过渡带山前植被物候时空变化探析[J]. 地理研究, 2022, 41(11):3000-3020.
doi: 10.11821/dlyj020211206
|
| [4] |
Li T T, Guo Z Z, Ma C. Spatiotemporal changes of piedmont phenology in the transitional zone between the second and third steps,China[J]. Geographical Research, 2022, 41(11):3000-3020.
|
| [5] |
Jonsson P, Eklundh L. Seasonality extraction by function fitting to time-series of satellite sensor data[J]. IEEE Transactions Geoscience and Remote Sensing, 2002, 40(8):1824-1832.
|
| [6] |
孙梦鑫, 张岳, 辛宇, 等. 川西高原近20 a植被物候变化及其对气候变化的响应[J]. 生态环境学报, 2022, 31(7):1326-1339.
doi: 10.16258/j.cnki.1674-5906.2022.07.005
|
| [6] |
Sun M X, Zhang Y, Xin Y, et al. Changes of vegetation phenology and its response to climate change in the west Sichuan Plateau in the past 20 years[J]. Ecology and Environmental Sciences, 2022, 31(7):1326-1339
|
| [7] |
张仁平, 郭靖, 马晓芳, 等. 基于MODIS数据的新疆草地物候提取方法及变化趋势分析[J]. 草业学报, 2022, 31(1):1-12.
doi: 10.11686/cyxb2020510
|
| [7] |
Zhang R P, Guo J, Ma X F, et al. Grassland phenology extraction for Xinjiang Province and trend analysis using MODIS data[J]. Acta Prataculturae Sinica, 2022, 31(1):1-12.
|
| [8] |
Shen M G, Piao S L, Cong N, et al. Precipitation impacts on vegetation spring phenology on the Tibetan Plateau[J]. Global Change Biology, 2015, 21(10):3647-3656.
doi: 10.1111/gcb.12961
pmid: 25926356
|
| [9] |
Wang C, Cao R Y, Chen J, et al. Temperature sensitivity of spring vegetation phenology correlates to within-spring warming speed over the Northern Hemisphere[J]. Ecological Indicators, 2015, 50:62-68.
|
| [10] |
魏晓帅, 高永龙, 范雅倩, 等. 北京植被净初级生产力对物候变化的响应[J]. 农业工程学报, 2022, 38(18):167-175.
|
| [10] |
Wei X S, Gao Y L, Fan Y Q, et al. Responses of the net primary productivity of vegetation to phenological changes in Beijing of China[J]. Transactions of the Chinese Society of Agricultural Engineering, 2022, 38(18):167-175.
|
| [11] |
代武君, 金慧颖, 张玉红, 等. 植物物候学研究进展[J]. 生态学报, 2020, 40(19):6705-6719.
|
| [11] |
Dai W J, Jin H Y, Zhang Y H, et al. Advances in plant phenology[J]. Acta Ecologica Sinica, 2020, 40(19):6705-6719.
|
| [12] |
Zhang Q, Kong D D, Shi P J, et al. Vegetation phenology on the Qinghai-Tibetan Plateau and its response to climate change(1982-2013)[J]. Agricultural and Forest Meteorology, 2018, 248:408-417.
|
| [13] |
Gao X, Zhao D. Impacts of climate change on vegetation phenology over the Great Lakes Region of Central Asia from 1982 to 2014[J]. The Science of the Total Environment, 2022, 845:157227.
|
| [14] |
钟巧, 焦黎, 李稚, 等. 博斯腾湖流域潜在蒸散发时空演变及归因分析[J]. 干旱区地理, 2019, 42(1):103-112.
|
| [14] |
Zhong Q, Jiao L, Li Z, et al. Spatial and temporal changes of potential evapotranspiration and its attribution in the Bosten Lake Basin[J]. Arid Land Geography, 2019, 42(1):103-112.
|
| [15] |
胡明新, 周广胜, 吕晓敏, 等. 温度和光周期协同作用对蒙古栎幼苗春季物候的影响[J]. 生态学报, 2021, 41(7):2816-2825.
|
| [15] |
Hu M X, Zhou G S, Lyu X M, et al. Interactive effects of different warming and changing photoperiod on spring phenology of Quercus mongolicus seedlings[J]. Acta Ecologica Sinica, 2021, 41(7):2816-2825.
|
| [16] |
李耀斌, 张远东, 顾峰雪, 等. 中国温带草原和荒漠区域春季物候的变化及其敏感性分析[J]. 林业科学研究, 2019, 32(4):1-10.
|
| [16] |
Li Y B, Zhang Y D, Gu F X, et al. Changes of spring phenology and sensitivity analysis in temperate grassland and desert zones of China[J]. Forest Research, 2019, 32(4):1-10.
|
| [17] |
Zhou D C, Zhao S Q, Zhang L X, et al. Remotely sensed assessment of urbanization effects on vegetation phenology in China’s 32 major cities[J]. Remote Sensing of Environment, 2016, 176:272-281.
|
| [18] |
Li X C, Zhou Y Y, Asrar G R, et al. Response of vegetation phenology to urbanization in the conterminous United States[J]. Global Change Biology, 2017, 23(7):2818-2830.
doi: 10.1111/gcb.13562
pmid: 27988975
|
| [19] |
Mathew A, Khandelwal S, Kaul N. Investigating spatial and seasonal variations of urban heat island effect over Jaipur city and its relationship with vegetation,urbanization and elevation parameters[J]. Sustainable Cities and Society, 2017, 35:157-177.
|
| [20] |
张聪聪, 孟丹, 李小娟. 京津冀地区植被物候时空变化及其对城市化的响应[J]. 生态学报, 2023, 43(1):249-262.
|
| [20] |
Zhang C C, Meng D, Li X J. Spatial and temporal changes of vegetation phenology and its response to urbanization in the Beijing-Tianjin-Hebei region[J]. Acta Ecologica Sinica, 2023, 43(1):249-262.
|
| [21] |
胡召玲, 戴慧, 侯飞, 等. 中国东北城乡植被物候时空变化及其对地表温度的响应[J]. 生态学报, 2020, 40(12):4137-4145.
|
| [21] |
Hu Z L, Dai H, Hou F, et al. Spatio-temporal change of urban-rural vegetation phenology and its response to land surface temperature in Northeast China[J]. Acta Ecologica Sinica, 2020, 40(12):4137-4145.
|
| [22] |
蔡红艳, 杨小唤, 张树文. 植物物候对城市热岛响应的研究进展[J]. 生态学杂志, 2014, 33(1):221-228.
|
| [22] |
Cai H Y, Yang X H, Zhang S W. Research advances in plant phenological responses to urban heat island[J]. Chinese Journal of Ecology, 2014, 33(1):221-228.
|
| [23] |
Yang J, Huang X. The 30 m annual land cover dataset and its dynamics in China from 1990 to 2019[J]. Earth System Science Data, 2021, 13(8):3907-3925.
|
| [24] |
Li X C, Gong P, Zhou Y Y, et al. Mapping global urban boundaries from the global artificial impervious area (GAIA) data[J]. Environmental Research Letters. 2020. 15(9):094044.
|
| [25] |
丁海勇, 卜亚勤, 徐路明. 长三角地区植被物候时空变化及其对城市化的响应[J]. 安全与环境学报, 2021, 21(3):1352-1360.
|
| [25] |
Ding H Y, Bu Y Q, Xu L M. Spatial and temporal variation of the plant phenology and its response to the urbanization trend in the Yangtze River delta[J]. Journal of Safety and Environment, 2021, 21(3):1352-1360.
|
| [26] |
韩红珠, 白建军, 张波, 等. 基于 MODIS 时序的陕西省植被物候时空变化特征分析[J]. 国土资源遥感, 2018, 30(4):125-131.doi:10.6046/gtzyyg.2018.04.19.
|
| [26] |
Han H Z, Bai J J, Zhang B, et al. Spatial-temporal characteristics of vegetation phenology in Shaanxi Province based on MODIS time series[J]. Remote Sensing for Natural Resources, 2018,(4):125-131.doi:10.6046/gtzyyg.2018.04.19.
|
| [27] |
周稳, 迟永刚, 周蕾. 基于日光诱导叶绿素荧光的北半球森林物候研究[J]. 植物生态学报, 2021, 45(4):345-354.
|
| [27] |
Zhou W, Chi Y G, Zhou L. Vegetation phenology in the Northern Hemisphere based on the solar-induced chlorophyll fluorescence[J]. Chinese Journal of Plant Ecology, 2021, 45(4):345-354.
|
| [28] |
周玉科, 刘建文. 基于MODIS NDVI和多方法的青藏高原植被物候时空特征分析[J]. 遥感技术与应用, 2018, 33(3):486-498.
|
| [28] |
Zhou Y K, Liu J W. Spatio-temporal analysis of vegetation phenology with multiple methods over the Tibetan Plateau based on MODIS NDVI data[J]. Remote Sensing Technology and Application, 2018, 33(3):486-498.
|
| [29] |
White M A, DeBEURS K M, Didan K, et al. Intercomparison,interpretation, and assessment of spring phenology in North America estimated from remote sensing for 1982-2006[J]. Global Change Biology, 2009, 15(10):2335-2359.
|
| [30] |
吉珍霞, 裴婷婷, 陈英, 等. 黄土高原植被物候变化及其对季节性气候变化的响应[J]. 生态学报, 2021, 41(16):6600-6612.
|
| [30] |
Ji Z X, Pei T T, Chen Y, et al. Vegetation phenology change and its response to seasonal climate changes on the Loess Plateau[J]. Acta Ecologica Sinica, 2021, 41(16):6600-6612.
|
| [31] |
覃嘉佳, 张继红, 张勇, 等. 季节性气候对不同草地植被物候变化的影响[J]. 遥感信息, 2022, 37(4):10-15.
|
| [31] |
Qin J J, Zhang J H, Zhang Y, et al. Grassland vegetation phenology change and its response to seasonal climate[J]. Remote Sensing Information, 2022, 37(4):10-15.
|
| [32] |
石智宇, 王雅婷, 赵清, 等. 2001-2020年中国植被净初级生产力时空变化及其驱动机制分析[J]. 生态环境学报, 2022, 31(11):2111-2123.
doi: 10.16258/j.cnki.1674-5906.2022.11.002
|
| [32] |
Shi Z Y, Wang Y T, Zhao Q, et al. The spatiotemporal changes of NPP and its driving mechanisms in China from 2001 to 2020[J]. Ecology and Environmental Sciences, 2022, 31(11):2111-2123.
|
| [33] |
Guo M, Li J, He H S, et al. Detecting global vegetation changes using mann-kendal (MK) trend test for 1982-2015 time period[J]. Chinese Geographical Science, 2018, 28(6):907-919.
|
| [34] |
赖小红, 李名扬, 刘聪, 等. 植物物候对重庆主城区热岛效应的响应[J]. 生态学报, 2019, 39(19):7025-7034.
|
| [34] |
Lai X H, Li M Y, Liu C, et al. The phenological responses of plants to the heat island effect in the main urban area of Chongqing[J]. Acta Ecologica Sinica, 2019, 39(19):7025-7034.
|
| [35] |
王彦超, 朱一丹, 徐丹丹. 基于Landsat 8影像的南京市热岛效应对植物物候的影响[J]. 南京林业大学学报(自然科学版), 2018, 61(6):99-105.
|
| [35] |
Wang Y C, Zhu Y D, Xu D D. The impact of urban heat island of Landsat 8 OLI on plant phenology in Nanjing[J]. Journal of Nanjing Forestry University (Natural Sciences Edition), 2018, 42(6):99-105.
|
|
Viewed |
|
|
|
Full text
|
|
|
|
|
Abstract
|
|
|
|
|
Cited |
|
|
|
|
| |
Shared |
|
|
|
|
| |
Discussed |
|
|
|
|
 2024,
Vol. 36
2024,
Vol. 36
 ), DING Haiyong(