|
|
 |
|

|
|
|
Identification and yield prediction of sugarcane in the south-central part of Guangxi Zhuang Autonomous Region, China based on multi-source satellite-based remote sensing images |
LUO Wei1( ), LI Xiuhua1,2(), QIN Huojuan1, ZHANG Muqing2, WANG Zeping3, JIANG Zhuhui4 ), LI Xiuhua1,2(), QIN Huojuan1, ZHANG Muqing2, WANG Zeping3, JIANG Zhuhui4 |
1. School of Electrical Engineering, Guangxi University, Nanning 530004, China
2. Guangxi Key Laboratory of Sugarcane Biology, Guangxi University, Nanning 530004, China
3. Sugarcane Research Institute, Guangxi Academy of Agricultural Sciences, Nanning 530007, China
4. Guangxi Sugar Industry Group, Nanning 530022, China |
|
|
|
|
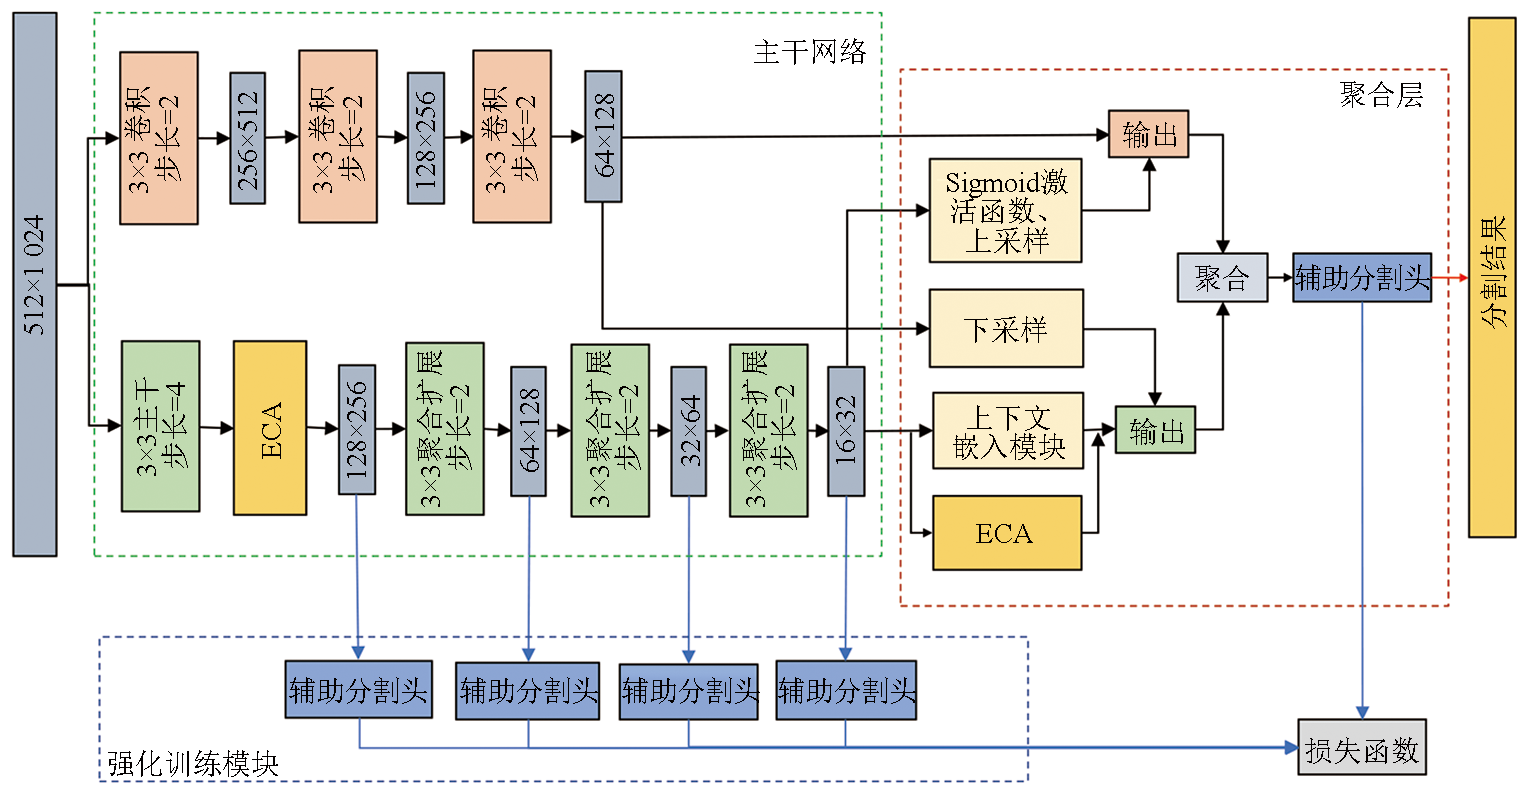
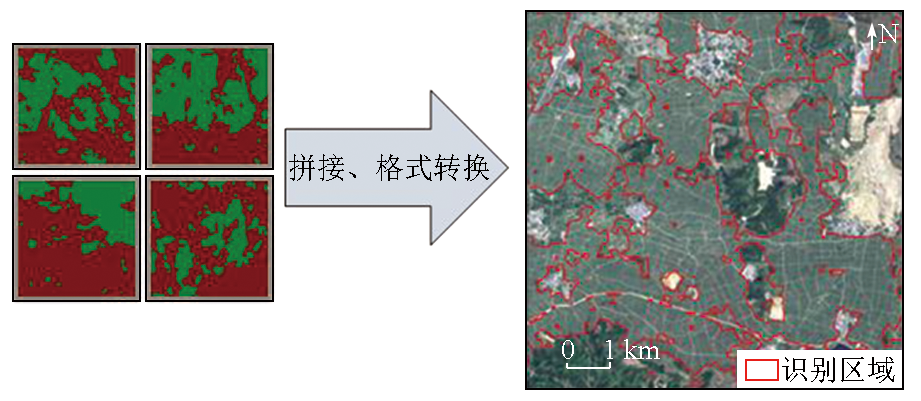
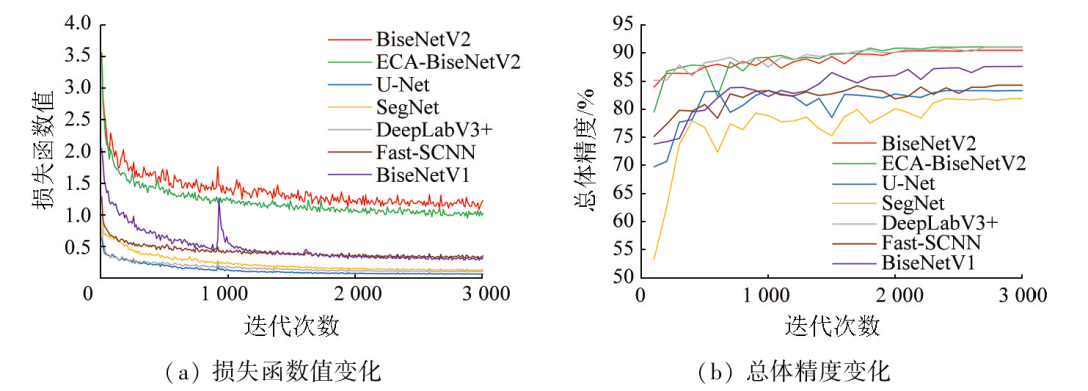
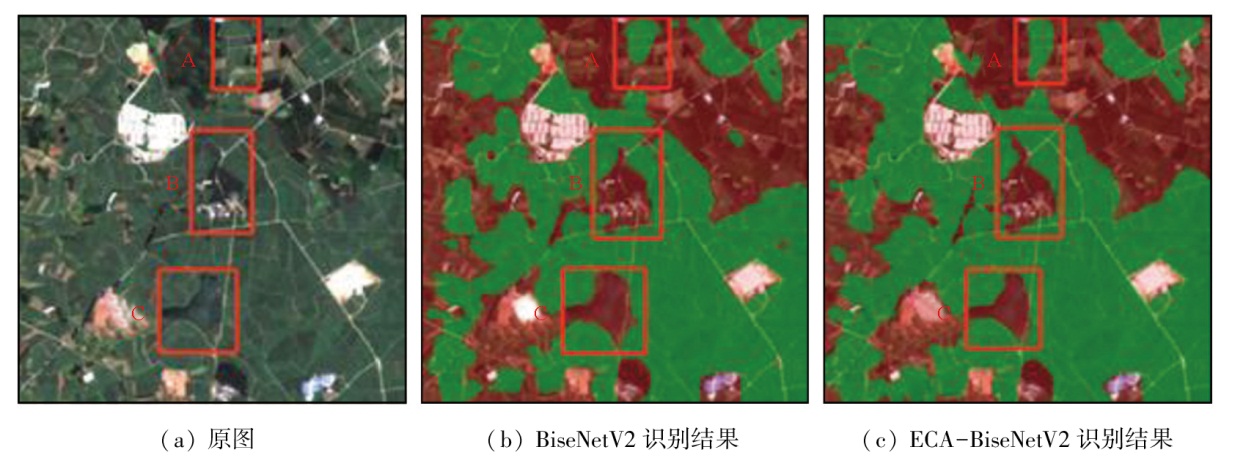
Abstract This study aims to solve the challenges faced in the prediction of sugarcane yield in Guangxi, such as varied crops, complex investigations in the sugarcane planting areas, and difficult acquisition of remote-sensing images caused by the changeable weather. To this end, an improved semantic segmentation algorithm based on Sentinel-2 images was proposed to automatically identify sugarcane planting areas, and an extraction method for representative spectral features was developed to build a sugarcane yield prediction model based on multi-temporal Sentinel-2 and Landsat8 images. First, an ECA-BiseNetV2 identification model for sugarcane planting areas was constructed by introducing an efficient channel attention (ECA) module into the BiseNetV2 lightweight unstructured network. As a result, the overall pixel classification accuracy reached up to 91.54%, and the precision for sugarcane pixel identification was up to 95.57%. Then, multiple vegetation indices of different growth periods of the identified sugarcane planting areas were extracted, and the Landsat8 image-derived vegetation indices were converted into Sentinel-2 image-based ones using a linear regression model to reduce the differences of the indices derived using images from the two satellites. Subsequently, after the fitting of time-series data of the extracted vegetation indices using a cubic curve, the maximum indices were obtained as the representative spectral features. Finally, a yield prediction model was built using multiple machine learning algorithms. The results indicate that the test set of the decision tree model built using the fitted maximum values of the vegetation indices yielded R? of up to 0.759, 4.3%, higher than that (0.792) of the model built using the available actual maximum values. Therefore, this method can effectively resolve the difficulty in developing an accurate sugarcane yield prediction model caused by changeable weather-induced lack of remote sensing images of sugarcane of the key growth periods.
|
| Keywords
semantic segmentation
vegetation index
sugarcane yield prediction
satellite remote sensing
time-series
|
|
|
|
Issue Date: 03 September 2024
|
|
|
| [1] |
邓宇驰, 刘晓婷, 黄莹, 等. 广西崇左蔗区2022年糖料蔗生产调查[J]. 中国种业, 2022(10):48-51.
|
| [1] |
Deng Y C, Liu X T, Huang Y, et al. Investigation on sugar cane production in Chongzuo sugarcane area of Guangxi in 2022[J]. China Seed Industry, 2022(10):48-51.
|
| [2] |
Taufik A, Syed Ahmad S S, Azmi E F. Classification of Landsat8 satellite data using unsupervised methods[C]// Piuri V,Balas V,Borah S,et al.Intelligent and Interactive Computing.Singapore:Springer, 2019:275-284.
|
| [3] |
陈洋波, 窦鹏, 张涛. 基于Landsat的多分类器集成遥感影像分类[J]. 测绘科学, 2018, 43(8):97-103,109.
|
| [3] |
Chen Y B, Dou P, Zhang T. Multiple classifiers integrated classification based on Landsat imagery[J]. Science of Surveying and Mapping, 2018, 43(8):97-103,109.
|
| [4] |
栗旭升, 李虎, 陈冬花, 等. 联合GF-5与GF-6卫星数据的多分类器组合亚热带树种识别[J]. 林业科学, 2020, 56(10):93-104.
|
| [4] |
Li X S, Li H, Chen D H, et al. Multiple classifiers combination method for tree species identification based on GF-5 and GF-6[J]. Scientia Silvae Sinicae, 2020, 56(10):93-104.
|
| [5] |
吴玉鑫, 王卷乐, 韩保民, 等. 基于时空谱特征的墨脱县森林分类方法与实现[J]. 自然资源遥感, 2023, 35(1):180-188.doi:10.6046/zrzyyg.2022016.
|
| [5] |
Wu Y X, Wang J L, Han B M, et al. Forest classification for Motuo County:A method based on spatio-temporal-spectral characteristics[J]. Remote Sensing for Natural Resources, 2023, 35(1):180-188.doi:10.6046/zrzyyg.2022016.
|
| [6] |
李玉峰, 林辉. 基于CNN的多光谱遥感图像地物覆盖分类[J]. 微处理机, 2019, 40(1):43-48.
|
| [6] |
Li Y F, Lin H. Multi-spectral remote sensing image classification of ground coverage based on CNN[J]. Microprocessors, 2019, 40(1):43-48.
|
| [7] |
Nascimento B H, Garcia F L M, Schwieder M, et al. Detailed agricultural land classification in the Brazilian cerrado based on phenological information from dense satellite image time series[J]. International Journal of Applied Earth Observation and Geoinformation, 2019, 82:101872.
|
| [8] |
Liu Q, Basu S, Ganguly S, et al. DeepSat V2:Feature augmented convolutional neural nets for satellite image classification[J]. Remote Sensing Letters, 2020, 11(2):156-165.
|
| [9] |
姜楠, 张雪红, 汶建龙, 等. 基于高分六号宽幅影像的油菜种植分布区域提取方法[J]. 地球信息科学学报, 2021, 23(12):2275-2291.
doi: 10.12082/dqxxkx.2021.210233
|
| [9] |
Jiang N, Zhang X H, Wen J L, et al. Extraction method of rapeseed planting distribution area based on GF-6 WFV image[J]. Journal of Geo-Information Science, 2021, 23(12):2275-2291.
|
| [10] |
伊尔潘·艾尼瓦尔, 买买提·沙吾提, 买合木提·巴拉提. 基于GF-2影像和Unet模型的棉花分布识别[J]. 自然资源遥感, 2022, 34(2):242-250.doi:10.6046/zrzyyg.2021135.
|
| [10] |
Erpaw A, Mamat S, Maihemuti B. Recognition of cotton distribution based on GF-2 images and Unet model[J]. Remote Sensing for Natural Resources, 2022, 34(2):242-250.doi:10.6046/zrzyyg.2021135.
|
| [11] |
Poortinga A, Thwal N S, Khanal N, et al. Mapping sugarcane in Thailand using transfer learning,a lightweight convolutional neural network,NICFI high resolution satellite imagery and Google Earth Engine[J]. ISPRS Open Journal of Photogrammetry and Remote Sensing, 2021, 1:100003.
|
| [12] |
Shang S, Zhang J, Wang X, et al. Faster and lighter meteorological satellite image classification by a lightweight channel-dilation-concatenation net[J]. IEEE Journal of Selected Topics in Applied Earth Observations and Remote Sensing, 2023, 16:2301-2317.
|
| [13] |
黄冬梅, 陈燕丽, 莫建飞, 等. 广西典型地貌植被覆盖度随地形的变化特征[J]. 广西林业科学, 2022, 51(5):626-633.
doi: 10.19692/j.issn.1006-1126.20220505
|
| [13] |
Huang D M, Chen Y L, Mo J F, et al. Vegetation coverage change characteristics of typical landforms in Guangxi with topography[J]. Guangxi Forestry Science, 2022, 51(5):626-633.
doi: 10.19692/j.issn.1006-1126.20220505
|
| [14] |
黄基杰. 甘蔗地快速识别的样本库建设——以广西崇左为例[J]. 南方国土资源, 2019(4):45-47.
|
| [14] |
Huang J J. Construction of sample database for rapid identification of sugarcane fields:A case study of Chongzuo,Guangxi[J]. Nanfang Guotu Ziyuan, 2019(4):45-47.
|
| [15] |
Wang M, Liu Z, Ali Baig M H, et al. Mapping sugarcane in complex landscapes by integrating multi-temporal Sentinel-2 images and machine learning algorithms[J]. Land Use Policy, 2019, 88:104190.
|
| [16] |
Lofton J, Tubana B S, Kanke Y, et al. Estimating sugarcane yield potential using an in-season determination of normalized difference vegetative index[J]. Sensors, 2012, 12(6):7529-7547.
doi: 10.3390/s120607529
pmid: 22969359
|
| [17] |
Fernandes J L, Rocha J V, Lamparelli R A C. Sugarcane yield estimates using time series analysis of spot vegetation images[J]. Scientia Agricola, 2011, 68(2):139-146.
|
| [18] |
Rahman M M, Robson A. Integrating Landsat-8 and sentinel-2 time series data for yield prediction of sugarcane crops at the block level[J]. Remote Sensing, 2020, 12(8):1313.
|
| [19] |
张淮栋, 陈争光, 张成龙. 基于高分二号-NDVI的大豆遥感估产的时相选择[J]. 湖北农业科学, 2018, 57(6):103-108.
|
| [19] |
Zhang H D, Chen Z G, Zhang C L. Time selection of estimation yield with remote sensing of soybean based on GF-2-NDVI[J]. Hubei Agricultural Sciences, 2018, 57(6):103-108.
|
| [20] |
朱再春, 陈联裙, 张锦水, 等. 基于信息扩散和关键期遥感数据的冬小麦估产模型[J]. 农业工程学报, 2011, 27(2):187-193,398.
|
| [20] |
Zhu Z C, Chen L Q, Zhang J S, et al. Winter wheat yield estimation model based on information diffusion and remote sensing data at major growth stages[J]. Transactions of the Chinese Society of Agricultural Engineering, 2011, 27(2):187-193,398.
|
| [21] |
王恺宁, 王修信. 多植被指数组合的冬小麦遥感估产方法研究[J]. 干旱区资源与环境, 2017, 31(7):44-49.
|
| [21] |
Wang K N, Wang X X. Research on winter wheat yield estimation with the multiply remote sensing vegetation index combination[J]. Journal of Arid Land Resources and Environment, 2017, 31(7):44-49.
|
| [22] |
娄正方, 李国清, 张向军, 等. 一种顾及多参数的冬小麦遥感估产方法与应用[J]. 测绘通报, 2021(s1):154-158.
|
| [22] |
Lou Z F, Li G Q, Zhang X J, et al. A method of winter wheat yield estimation by considering multiple parameters andits application[J]. Bulletin of Surveying and Mapping, 2021(s1):154-158.
|
| [23] |
贾艳红, 苏筱茜, 李鹤冉. 1991—2020年南宁市气候变化特征分析[J]. 广西师范大学学报(自然科学版), 2023, 41(2):190-200.
|
| [23] |
Jia Y H, Su X Q, Li H R. Characteristic analysis of climate change in Nanning from 1991 to 2020[J]. Journal of Guangxi Normal University (Natural Science Edition), 2023, 41(2):190-200.
|
| [24] |
Shelhamer E, Long J, Darrell T. Fully convolutional networks for semantic segmentation[C]// IEEE Transactions on Pattern Analysis and Machine Intelligence.IEEE, 2017:640-651.
|
| [25] |
Ronneberger O, Fischer P, Brox T. U-net:Convolutional networks for biomedical image segmentation[M]// Lecture Notes in Computer Science. Cham: Springer International Publishing, 2015:234-241.
|
| [26] |
Yu C, Gao C, Wang J, et al. BiSeNet V2:Bilateral network with guided aggregation for real-time semantic segmentation[J]. International Journal of Computer Vision, 2021, 129(11):3051-3068.
|
| [27] |
Wang Q, Wu B, Zhu P, et al. ECA-net:Efficient channel attention for deep convolutional neural networks[C]// 2020 IEEE/CVF Conference on Computer Vision and Pattern Recognition (CVPR).Seattle,WA,USA.IEEE, 2020:11531-11539.
|
| [28] |
Badrinarayanan V, Kendall A, Cipolla R. SegNet:A deep convolutional encoder-decoder architecture for image segmentation[J]. IEEE Transactions on Pattern Analysis and Machine Intelligence, 2017, 39(12):2481-2495.
doi: 10.1109/TPAMI.2016.2644615
pmid: 28060704
|
| [29] |
Chen L C, Zhu Y, Papandreou G, et al. Encoder-decoder with atrous separable convolution for semantic image segmentation[C]// European Conference on Computer Vision.Cham:Springer, 2018:833-851.
|
| [30] |
Poudel R P K, Liwicki S, Cipolla R. Fast-SCNN:Fast semantic segmentation network[EB/OL]. 2019:arXiv:1902.04502. https://arxiv.org/abs/1902.04502.pdf
url: https://arxiv.org/abs/1902.04502.pdf
|
| [31] |
Yu C, Wang J, Peng C, et al. BiSeNet:Bilateral segmentation network for real-time semantic segmentation[C]// European Conference on Computer Vision.Cham:Springer, 2018:334-349.
|
| [32] |
Hosmer D W Jr, Lemeshow S, Sturdivant R X. Applied logistic regression[M]. Nev Hoboken: John Wiley and Sons Inc, 2013.
|
| [33] |
Pisner D A, Schnyer D M. Support vector machine[M]//Machine Learning. Amsterdam: Elsevier, 2020:101-121.
|
| [34] |
Priyanka N A, Kumar D. Decision tree classifier:A detailed survey[J]. International Journal of Information and Decision Sciences, 2020, 12(3):246.
|
| [35] |
Breiman L. Random forests[J]. Machine Learning, 2001, 45(1):5-32.
|
|
Viewed |
|
|
|
Full text
|
|
|
|
|
Abstract
|
|
|
|
|
Cited |
|
|
|
|
| |
Shared |
|
|
|
|
| |
Discussed |
|
|
|
|
 2024,
Vol. 36
2024,
Vol. 36