Please wait a minute...
 
Remote Sensing for Natural Resources    2025, Vol. 37 Issue (2) : 235-245     DOI: 10.6046/zrzyyg.2023370
|
Monitoring the spatiotemporal dynamics of mangrove forests in Beibu Gulf, Guangxi Zhuang Autonomous Region, China, using Google Earth Engine and time-series active and passive remote sensing images
DENG Jianming1,2(), YAO Hang3, FU Bolin3(), GU Sen1, TANG Jie1, GAN Yuanyuan4
1. Hydrology Center of Guangxi Zhuang Autonomous Region, Nanning 530023, China
2. Guigang Hydrology Center, Guigang 537110, China
3. College of Geomatics and Geoinformation, Guilin University of Technology, Guilin 541006, China
4. Guangxi Coastal Hydrology Center, Qinzhou 535000, China
Download: PDF(7478 KB)   HTML
Export: BibTeX | EndNote | Reference Manager | ProCite | RefWorks    
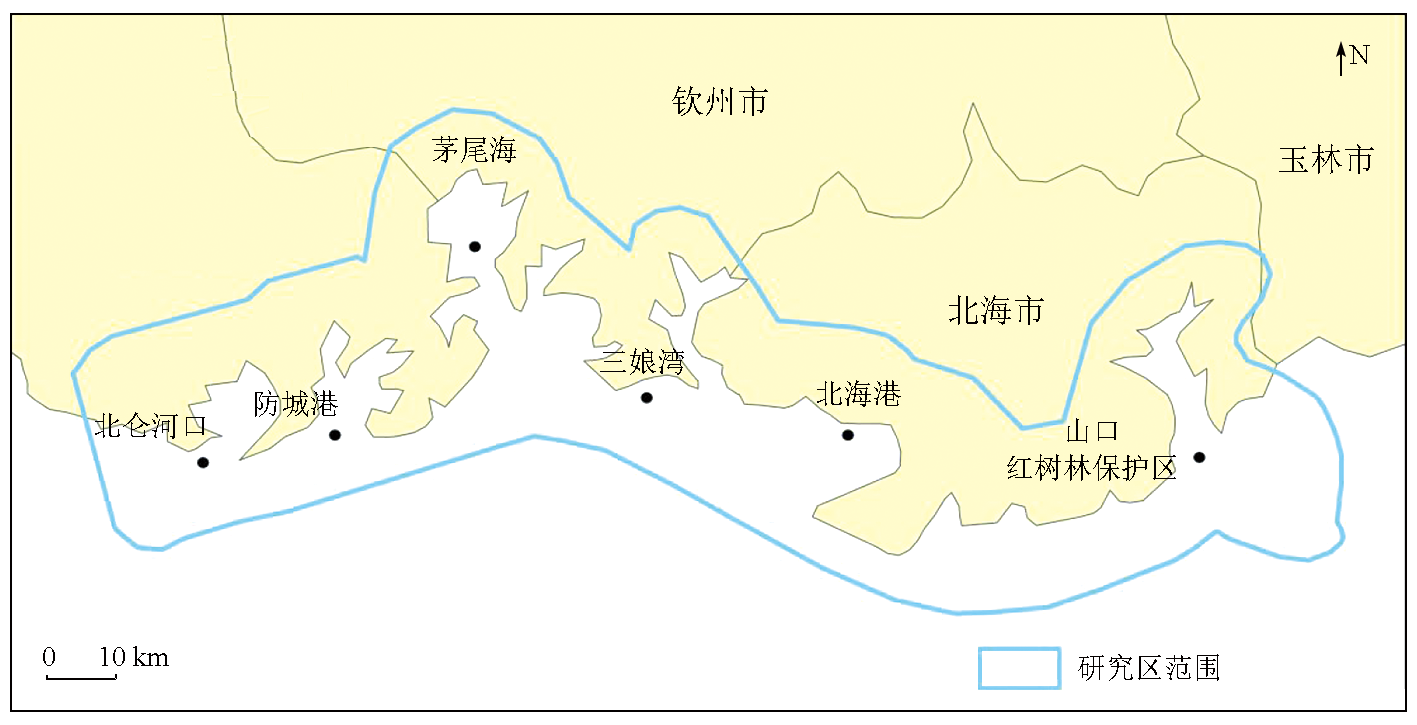
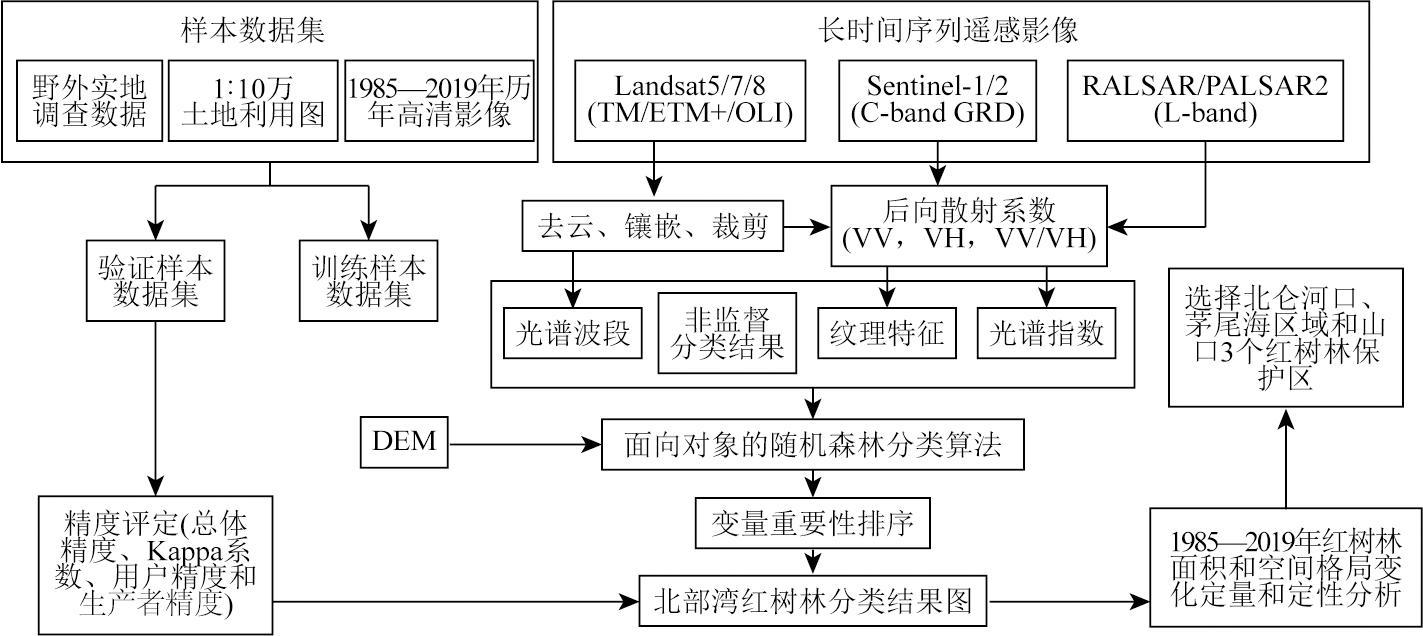
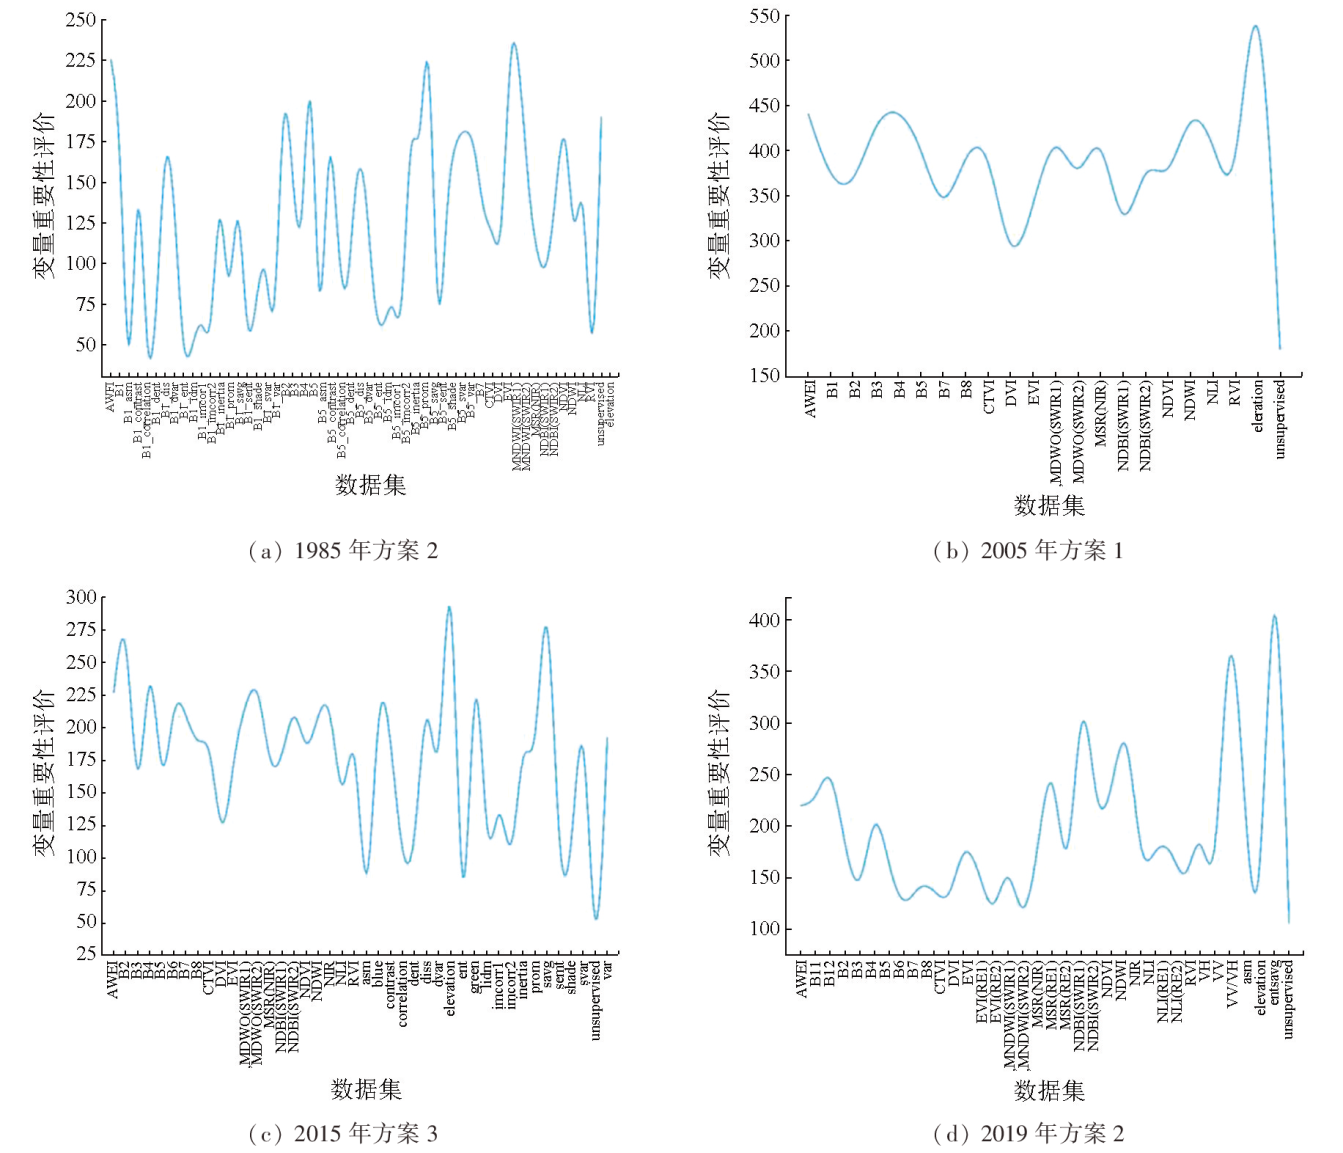
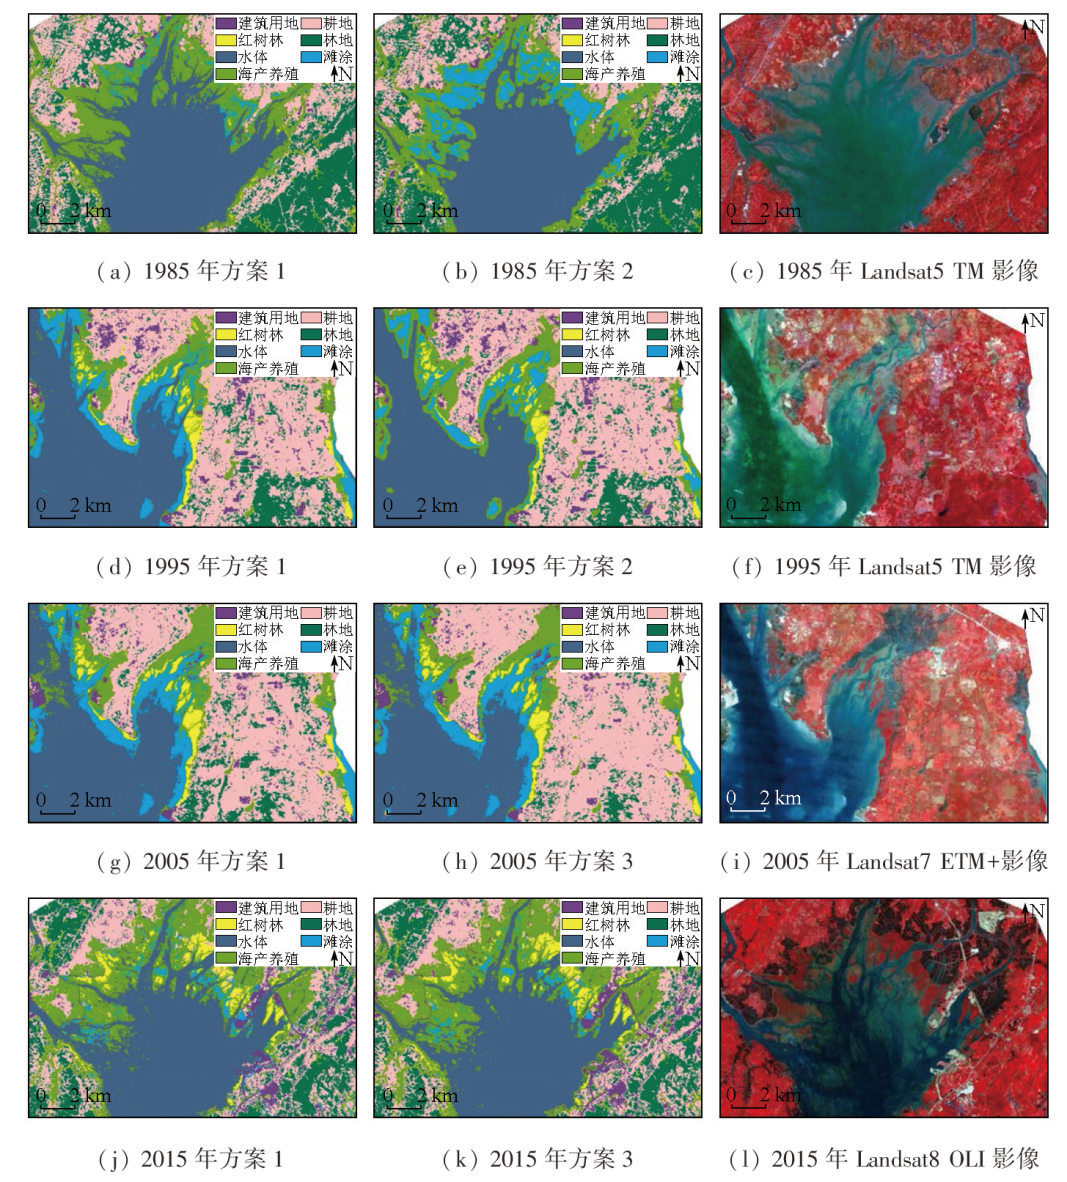
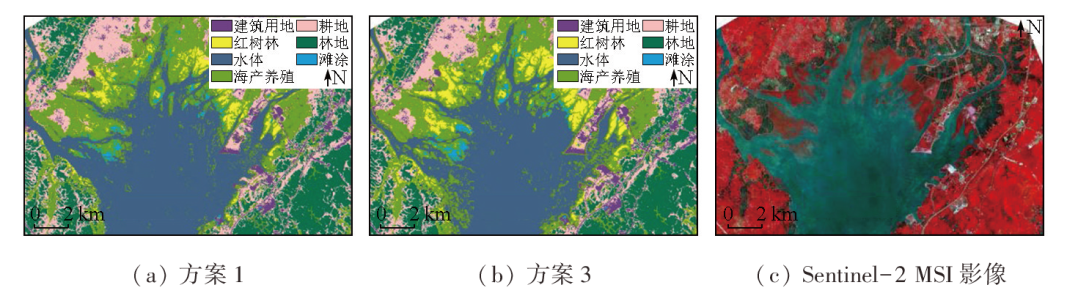
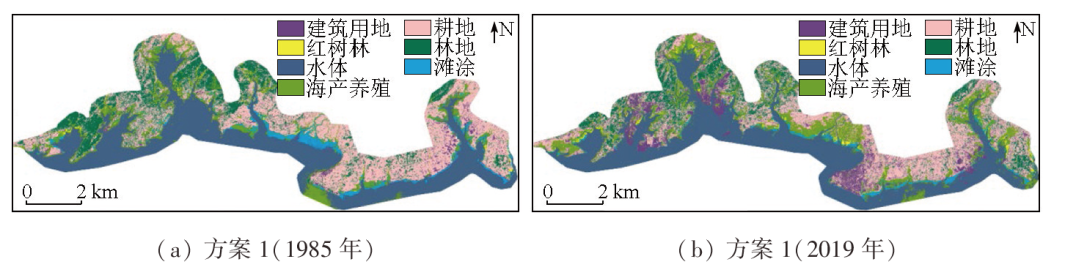
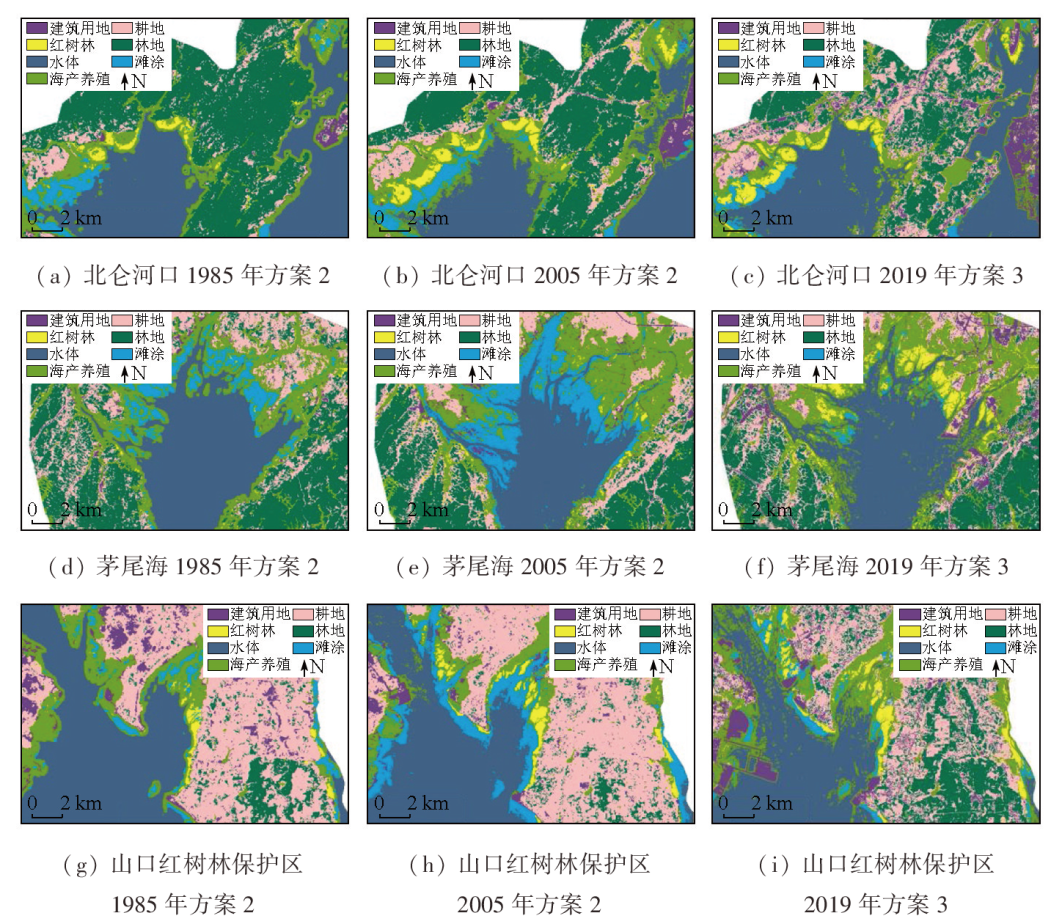
Abstract  

Mangrove forests are recognized as one of the most biodiverse and productive marine ecosystems globally. This study investigated Beibu Gulf, Guangxi Province. Using Landsat, Sentinel, and PALSAR SAR images from 1985 to 2019 as data sources, as well as the Google Earth Engine (GEE) cloud platform, this study established a multisource dataset by integrating spectral bands, spectral indices, texture features, digital elevation models (DEMs), and backscatter coefficients. Furthermore, 14 classification schemes were developed, and a mangrove remote sensing recognition model was built using an object-based random forest (RF) algorithm. Accordingly, the long-time-series spatiotemporal dynamics of mangrove forests in Beibu Gulf were monitored. The monitoring results show that the object-based RF algorithm demonstrates a high ability to identify mangrove forests. Specifically, Scheme 3 combined with data from 2019 yielded the highest overall accuracy (96.3%) and a kappa coefficient of 0.956, which are 16.3% and 0.195 higher than those of Scheme 1 combined data from 1995, respectively. The classification schemes differed in the producer’s and user’s accuracy of different surface features in the Beibu Gulf. Specifically, these schemes yielded the highest user’s and producer’s accuracy of mangrove forests exceeding 94.6% and 92.0%, respectively. From 1985 to 2019, the area of mangrove forests in Beibu Gulf showed an increasing trend, with an annual changing rate of 6.63%, and the area expanded from inland to coastal areas. The results of this study provide a reference for the protection and sustainable management of mangrove forests while also verifying the feasibility of monitoring long-term spatiotemporal dynamics of mangrove forests based on the GEE platform.

Keywords Beibu Gulf      mangrove forest      Google Earth Engine      active and passive remote sensing images      random forest (RF) algorithm      dynamic monitoring     
ZTFLH:  TP79  
Issue Date: 09 May 2025
Service
E-mail this article
E-mail Alert
RSS
Articles by authors
Jianming DENG
Hang YAO
Bolin FU
Sen GU
Jie TANG
Yuanyuan GAN
Cite this article:   
Jianming DENG,Hang YAO,Bolin FU, et al. Monitoring the spatiotemporal dynamics of mangrove forests in Beibu Gulf, Guangxi Zhuang Autonomous Region, China, using Google Earth Engine and time-series active and passive remote sensing images[J]. Remote Sensing for Natural Resources, 2025, 37(2): 235-245.
URL:  
https://www.gtzyyg.com/EN/10.6046/zrzyyg.2023370     OR     https://www.gtzyyg.com/EN/Y2025/V37/I2/235
Fig.1  The location of study area
年份 传感器 影像数 影像分辨率/m 影像筛选日期
1985年 Landsat5 TM 68 30 1984年5月30日—1989年10月30日
1995年 Landsat5 TM 46 30 1994年1月1日—1995年12月31日
2005年 Landsat7 ETM+ 108 15/30 2000年1月1日—2003年12月31日
L-band PALSAR/PALSAR-2 1 25 2007年1月1日—2007年12月31日
2015年 Landsat8 OLI 31 30 2015年1月1日—2015年12月31日
C-band Sentinel-1 GRD 16 20 2015年1月1日—2015年12月1日
2019年 Sentinel-2 MSI 720 10/20 2019年1月1日—2019年12月1日
C-band Sentinel-1 GRD 106 20 2019年1月1日—2019年12月1日
Tab.1  Multi-source remote sensing data
地物类型 解译标志 描述
Landsat影像 Sentinel影像 雷达影像
建筑用地 道路、城镇、沙地等,在标准假彩色中显示为灰白色、青绿色及亮白色,轮廓清晰且与周围地物分界明显
红树林 由密集分布的红树林群落组成,沿海岸带分布。在标准假彩色显示方案中,1985年、1995年Landsat5影像中的红树林主要表现为淡棕红色,2005—2019年影像中则主要表现为暗红色
水体 在标准假彩色中显示方案中,1985年、1995年海水为蓝绿色,2005—2019年海水为蓝色
海产养殖 包括虾塘等养殖塘,有明显的轮廓边界,形状较规则
耕地 在标准假彩色中表现为淡红色,且主要分布于内陆,形状较规则
林地 在标准假彩色中表现为比耕地更深的红色,且主要分布于内陆,时常与耕地相邻
滩涂 出现在沿岸海陆交汇区域,是红树林生长的沃土,在标准假彩色中表现为桃皮色
Tab.2  Interpretation signs and descriptions of ground objects in the study area
序号 指数类型 计算公式
1 归一化植被指数
(normalized difference vegetation index, NDVI)
N D V I = ( λ N I R - λ R E D ) / ( λ N I R + λ R E D )
2 比值植被指数(ratio vegetation index, RVI) R V I = λ R E D / λ N I R
3 差值植被指数(difference vegetation index, DVI) D V I = λ N I R - λ R E D
4 增强植被指数(enhanced vegetation index, EVI) E V I = 2.5 × λ N I R - λ R E D λ N I R + 6.0 λ R E D - 7.5 λ B L U E + 1
5 校正植被指数(corrected transformed vegetation index, CTVI) C T V I = N D V I + 0.5 | N D V I + 0.5 | | N D V I + 0.5 |
6 非线性指数(non-linear vegetation index, NLI) N L I = ( λ N I R 2 - λ R E D ) / ( λ N I R 2 + λ R E D )
7 改进简单比值指数(modified simple ratio, MSRNIR) M S R N I R = ( λ N I R λ R E D - 1 ) / λ N I R λ R E D + 1
8 归一化水体指数(normalized difference water index, NDWI) N D W I = ( λ S W I R - λ N I R ) / ( λ S W I R + λ N I R )
9 改进的归一化水体指数(modified normalized difference water index, MNDWI) N D W I S W I R 1 = ( λ S W I R 1 - λ N I R ) / ( λ S W I R 1 + λ N I R )
SWIR1(1.55~1.75 μm)
N D W I S W I R 2 = ( λ S W I R 2 - λ N I R ) / ( λ S W I R 2 + λ N I R )
SWIR2(2.08~2.35 μm)
10 自动提取水体指数(automated water extraction index, AWEI) A W E I = 4 ( λ G R E E N - λ S W I R 1 ) / ( 0.25 λ N I R + 0.75 λ S W I R 2 )
11 归一化建筑指数(normalized difference built-up index, NDBI) N D B I S W I R 1 = ( λ S W I R 1 - λ N I R ) / ( λ S W I R 1 + λ N I R )
SWIR1(1.55~1.75 μm)
N D B I S W I R 2 = ( λ S W I R 2 - λ N I R ) / ( λ S W I R 2 + λ N I R )
SWIR2(2.08~2.35 μm)
12 基于红边波段的改进简单比值指数(modified simple ratio, MSRRE1,MSRRE2) M S R R E 1 = ( λ R E 1 λ R E D - 1 ) / λ R E 1 λ R E D + 1
RE1(703.9 nm)
M S R R E 2 = ( λ R E 2 λ R E D - 1 ) / λ R E 2 λ R E D + 1
RE2(740.2 nm)
13 基于红边波段的非线性指数(non-linear index, NLIRE1,NLIRE2) N L I R E 1 = ( λ R E 1 2 - λ R E D ) / ( λ R E 1 2 + λ R E D )
RE1(703.9 nm)
N L I R E 2 = ( λ R E 2 2 - λ R E D ) / ( λ R E 2 2 + λ R E D )
RE2(740.2 nm)
14 基于红边波段的增强植被指数(enhanced vegetation index, EVIRE1,EVIRE2) E V I R E 1 = 2.5 × λ R E 1 - λ R E D λ R E 1 + 6.0 λ R E D - 7.5 λ B L U E + 1
RE1(703.9 nm)
E V I R E 2 = 2.5 × λ R E 2 - λ R E D λ R E 2 + 6.0 λ R E D - 7.5 λ B L U E + 1
RE2(740.2 nm)
15 微波遥感指数HH/HV PALSAR HH/HV
16 微波遥感指数VV/VH Sentinel-1 VV/VH
Tab.3  Calculation formula of each type of remote sensing index
年份 传感器 方案 变量数 多源数据集
1985年 Landsat5 TM 方案1 21 多光谱波段(6个波段)、各类遥感指数(植被指数、水体指数、建筑指数)、数字高程模型(digital elevation model,DEM)、非监督分类结果
方案2 55 多光谱波段(6个波段)、各类遥感指数(植被指数、水体指数、建筑指数)、DEM、非监督分类结果、B1(BLUE)波段纹理特征、B5(1.55~1.75 μm)波段纹理特征
1995年 Landsat5 TM 方案1 21 多光谱波段(6个波段)、各类遥感指数(植被指数、水体指数、建筑指数)、DEM、非监督分类结果
方案2 38 多光谱波段(6个波段)、各类遥感指数(植被指数、水体指数、建筑指数)、DEM、非监督分类结果、B5(1.55~1.75 μm)波段纹理特征
2005年 Landsat7 ETM+ 方案1 22 多光谱波段(7个波段)、各类遥感指数(13个)、DEM、非监督分类结果
方案2 25 多光谱波段(7个波段)、各类遥感指数(13个)、DEM、非监督分类结果、PALSAR/PALSAR-2 HH,HV,HH/HV
方案3 42 多光谱波段(7个波段)、各类指数(13个)、DEM、非监督分类结果、HSV波段融合、B4(NIR)波段纹理特征
2015年 Landsat8 OLI 方案1 55 多光谱波段(7个波段)、各类遥感指数(13个)、DEM、非监督分类结果
方案2 25 多光谱波段(7个波段)、各类遥感指数(13个)、DEM、非监督分类结果、C-band Sentinel-1 GRD VV,VH,VV/VH
方案3 42 多光谱波段(7个波段)、各类遥感指数(13个)、DEM、非监督分类结果、HSV波段融合、B7(2.11~2.29 μm)波段纹理特征
2019年 Sentinel-2 MSI 方案1 31 多光谱波段(10个波段)、各类遥感指数(16个)、DEM、非监督分类结果
方案2 34 多光谱波段(10个波段)、各类遥感指数(16个)、DEM、非监督分类结果、C-band Sentinel-1 GRD VV,VH,VV/VH
方案3 50 多光谱波段(10个波段)、各类遥感指数(16个)、DEM、非监督分类结果、B5(703.9 nm)波段纹理特征(9个)、B8(NIR)波段纹理特征(10个)
方案4 48 多光谱波段(10个波段)、各类遥感指数(16个)、DEM、非监督分类结果、B12(2 202.4 nm)波段纹理特征
Tab.4  Classification schemes and multi-source datasets
Fig.2  Technical route of this study
Fig.3  Quantitative evaluation of the importance of different remote sensing data sets from 1985 to 2015
Fig.4  Classification results based on different remote sensing images from 1985 to 2015
Fig.5  Classification results derived from Sentinel 2 MSI image in 2019
年份 方案 Kappa系数 总体分类精度/%
1985年 方案1 0.869 88.8
方案2 0.884 90.1
1995年 方案1 0.761 80.0
方案2 0.853 87.7
2005年 方案1 0.881 90.1
方案2 0.901 91.8
方案3 0.908 92.3
2015年 方案1 0.874 89.3
方案2 0.900 91.6
方案3 0.907 92.1
2019年 方案1 0.881 90.1
方案2 0.900 91.6
方案3 0.956 96.3
方案4 0.943 95.3
Tab.5  The overall classification accuracies and Kappa coefficient of different remote sensing data from 1985 to 2019
Fig.6  Classification results of the same remote sensing data set in 1985 and 2019
地类 1985年/km2 占比/% 1995年/km2 占比/% 2005年/km2 占比/% 2015年/km2 占比/%
建筑用地 142.79 3.12 184.49 4.03 203.19 4.44 483.43 10.55
红树林 22.84 0.50 43.17 0.94 55.33 1.21 66.36 1.45
水体 1 613.01 35.21 1 579.58 34.48 1 501.06 32.77 1 561.20 34.08
海产养殖 546.25 11.92 565.92 12.35 628.85 13.73 608.80 13.29
耕地 1 201.92 26.24 1 505.52 32.86 1 326.87 28.96 1 090.14 23.80
林地 886.90 19.36 531.07 11.59 587.27 12.82 569.34 12.43
滩涂 167.38 3.65 171.34 3.74 278.52 6.08 201.82 4.41
总计 4 581.09 100.00 4 581.09 100.00 4 581.09 100.00 4 581.09 100.00
Tab.6  The area of land use types from 1985 to 2019 (km2)
地类 1985—
1995
1995—
2005
2005—
2015
2015—
2019
1985—
2019
建筑用地 2.92 1.01 13.79 -0.33 6.50
红树林 8.90 2.82 1.99 1.11 6.36
水体 -0.21 -0.50 -0.40 0.12 -0.06
海产养殖 0.36 1.11 -0.32 1.29 0.74
耕地 2.53 -1.19 -1.78 -0.67 -0.44
林地 -4.01 1.06 -0.31 1.33 -0.78
滩涂 0.24 6.26 -2.75 -4.53 -0.97
Tab.7  Annual change rates of land use types from 1985 to 2019 (%)
Fig.7  Comparison of mangrove distribution in typical area of Beibu Gulf in 1985, 2005 and 2019
[1] 卢元平, 徐卫华, 张志明, 等. 中国红树林生态系统保护空缺分析[J]. 生态学报, 2019, 39(2):684-691.
[1] Lu Y P, Xu W H, Zhang Z M, et al. Gap analysis of mangrove ecosystem conservation in China[J]. Acta Ecologica Sinica, 2019, 39(2):684-691.
[2] 李想, 刘凯, 朱远辉, 等. 基于资源三号影像的红树林物种分类研究[J]. 遥感技术与应用, 2018, 33(2):360-369.
doi: 10.11873/j.issn.1004-0323.2018.2.0360
[2] Li X, Liu K, Zhu Y H, et al. Study on mangrove species classification based on ZY-3 image[J]. Remote Sensing Technology and Application, 2018, 33(2):360-369.
[3] Wang L, Jia M, Yin D, et al. A review of remote sensing for mangrove forests:1956—2018[J]. Remote Sensing of Environment, 2019, 231:111223.
[4] 孙永光, 赵冬至, 郭文永, 等. 红树林生态系统遥感监测研究进展[J]. 生态学报, 2013, 33(15):4523-4538.
[4] Sun Y G, Zhao D Z, Guo W Y, et al. A review on the application of remote sensing in mangrove ecosystem monitoring[J]. Acta Ecologica Sinica, 2013, 33(15):4523-4538.
[5] Giri C, Long J, Abbas S, et al. Distribution and dynamics of mangrove forests of South Asia[J]. Journal of Environmental Management, 2015, 148:101-111.
doi: 10.1016/j.jenvman.2014.01.020 pmid: 24735705
[6] 何斌源, 范航清, 王瑁, 等. 中国红树林湿地物种多样性及其形成[J]. 生态学报, 2007, 27(11):4859-4870.
[6] He B Y, Fan H Q, Wang M, et al. Species diversity in mangrove wetlands of China and its causation analyses[J]. Acta Ecologica Sinica, 2007, 27(11):4859-4870.
[7] Son N T, Chen C F, Chang N B, et al. Mangrove mapping and change detection in Ca mau peninsula,Vietnam,using landsat data and object-based image analysis[J]. IEEE Journal of Selected Topics in Applied Earth Observations and Remote Sensing, 2015, 8(2):503-510.
[8] Duke N C, Meynecke J O, Dittmann S, et al. A world without mangroves?[J]. Science, 2007, 317(5834):41-42.
doi: 10.1126/science.317.5834.41b pmid: 17615322
[9] Wang W, Fu H, Lee S Y, et al. Can strict protection stop the decline of mangrove ecosystems in China? from rapid destruction to rampant degradation[J]. Forests, 2020, 11(1):55.
[10] Food and Agriculture Organization of the United Nations (FAO). The World’s Mangroves 1980-2005[Z]. Roman,Italy, 2007.
[11] Richards D R, Friess D A. Rates and drivers of mangrove deforestation in Southeast Asia,2000-2012[J]. Proceedings of the National Academy of Sciences of the United States of America, 2016, 113(2):344-349.
doi: 10.1073/pnas.1510272113 pmid: 26712025
[12] Hu L, Xu N, Liang J, et al. Advancing the mapping of mangrove forests at national-scale using sentinel-1 and sentinel-2 time-series data with google earth engine:A case study in China[J]. Remote Sensing, 2020, 12(19):3120.
[13] Yin D, Wang L. Individual mangrove tree measurement using UAV-based LiDAR data:Possibilities and challenges[J]. Remote Sensing of Environment, 2019, 223:34-49.
[14] 蒙良莉, 凌子燕, 蒋卫国, 等. 基于Sentinel遥感数据的红树林信息提取研究——以广西茅尾海为例[J]. 地理与地理信息科学, 2020, 36(4):41-47.
[14] Meng L L, Ling Z Y, Jiang W G, et al. Mangrove information extraction based on the sentinel remote sensing data:A case study of Maoweihai Bay of Guangxi[J]. Geography and Geo-Information Science, 2020, 36(4):41-47.
[15] 周振超, 李贺, 黄翀, 等. 红树林遥感动态监测研究进展[J]. 地球信息科学学报, 2018, 20(11):1631-1643.
doi: 10.12082/dqxxkx.2018.180247
[15] Zhou Z C, Li H, Huang C, et al. Review on dynamic monitoring of mangrove forestry using remote sensing[J]. Journal of Geo-Information Science, 2018, 20(11):1631-1643.
[16] Jakovac C C, Latawiec A E, Lacerda E, et al. Costs and carbon benefits of mangrove conservation and restoration:A global analysis[J]. Ecological Economics, 2020, 176:106758.
[17] 徐逸, 甄佳宁, 蒋侠朋, 等. 无人机遥感与XGBoost的红树林物种分类[J]. 遥感学报, 2021, 25(3):737-752.
[17] Xu Y, Zhen J N, Jiang X P, et al. Mangrove species classification with UAV-based remote sensing data and XGBoost[J]. National Remote Sensing Bulletin, 2021, 25(3):737-752.
[18] 甄佳宁, 廖静娟, 沈国状. 1987以来海南省清澜港红树林变化的遥感监测与分析[J]. 湿地科学, 2019, 17(1):44-51.
[18] Zhen J N, Liao J J, Shen G Z. Remote sensing monitoring and analysis on the dynamics of mangrove forests in Qinglan habor of Hainan Province since 1987[J]. Wetland Science, 2019, 17(1):44-51.
[19] 李春干, 代华兵. 红树林空间分布信息遥感提取方法[J]. 湿地科学, 2014, 12(5):580-589.
[19] Li C G, Dai H B. Extraction of mangroves spatial distribution using remotely sensed data[J]. Wetland Science, 2014, 12(5):580-589.
[20] Gorelick N, Hancher M, Dixon M, et al. Google Earth Engine:Planetary-scale geospatial analysis for everyone[J]. Remote Sensing of Environment, 2017, 202:18-27.
[21] Kumar L, Mutanga O. Google earth engine applications since inception:Usage,trends,and potential[J]. Remote Sensing, 2018, 10(10):1509.
[22] Mandal M S H, Hosaka T. Assessing cyclone disturbances (1988-2016) in the Sundarbans mangrove forests using Landsat and Google Earth Engine[J]. Natural Hazards,2020, 102(1):133-150.
[23] Portengen E C. Classifying mangroves in Vietnam using radar and optical satellite remote sensing[D]. Delft: Delft University of Technology, 2017.
[24] 沈小雪, 关淳雅, 王茜, 等. 红树林生态开发现状与对策研究[J]. 中国环境科学, 2020, 40(9):4004-4016.
[24] Shen X X, Guan C Y, Wang Q, et al. Study on the current situation and countermeasures of mangrove ecological exploitation[J]. China Environmental Science, 2020, 40(9):4004-4016.
[25] Liao J, Zhen J, Zhang L, et al. Understanding dynamics of mangrove forest on protected areas of Hainan island,China:30 years of evidence from remote sensing[J]. Sustainability, 2019, 11(19):5356.
[26] Jia M, Wang Z, Zhang Y, et al. Monitoring loss and recovery of mangrove forests during 42 years:The achievements of mangrove conservation in China[J]. International Journal of Applied Earth Observation and Geoinformation, 2018, 73:535-545.
[1] XUE Zhiyong, LI Weiwei, TIAN Zhen, ZHU Mingjie, ZHU Jianhua. GEE-based fine-scale classification of mangrove species in Hainan Island considering polarization and topographic features[J]. Remote Sensing for Natural Resources, 2025, 37(2): 274-284.
[2] LI Weiwei, XUE Zhiyong, ZHU Jianhua, TIAN Zhen. Estimating the carbon stocks of mangrove forests in Hainan Island based on multisource remote sensing data and Google Earth Engine[J]. Remote Sensing for Natural Resources, 2025, 37(2): 220-227.
[3] CHEN Zhiyang, MAO Dehua, WANG Zongming, LIN Nan, JIA Mingming, REN Chunying, WANG Ming. Information extraction of aquaculture ponds in the Jianghan Plain based on Sentinel-2 time-series data[J]. Remote Sensing for Natural Resources, 2025, 37(1): 169-178.
[4] CHEN Yuanyuan, YAN Shuoting, YAN Jin, ZHENG Siqi, WANG Hao, ZHU Jie. Forest disturbance monitoring in Lishui City, China based on Landsat time series images and the LandTrendr algorithm[J]. Remote Sensing for Natural Resources, 2025, 37(1): 179-187.
[5] CHEN Li, ZHANG Xian, LI Wei, LI Yu, CHEN Haomin. Hierarchical multi-scale segmentation-based information extraction and dynamic monitoring for the Tagaung Taung nickel deposit, Myanmar[J]. Remote Sensing for Natural Resources, 2024, 36(4): 55-61.
[6] WEI Xin, REN Yu, CHEN Xidong, HU Qingfeng, LIU Hui, ZHOU Jing, SONG Dongwei, ZHANG Peipei, HUANG Zhiquan. Monitoring of dynamic changes in water bodies of Henan Province based on time-series Sentinel-2 data[J]. Remote Sensing for Natural Resources, 2024, 36(2): 268-278.
[7] XUE Zhiyong, TIAN Zhen, ZHU Jianhua, ZHAO Yang. Monitoring of inter-annual variations in mangrove forests in the Bamen Bay area based on Google Earth Engine[J]. Remote Sensing for Natural Resources, 2024, 36(2): 279-286.
[8] FENG Qian, ZHANG Jiahua, DENG Fan, WU Zhenjiang, ZHAO Enling, ZHENG Peixin, HAN Yang. A mapping methodology for wetland categories of the Yellow River Delta based on optimal feature selection and spatio-temporal fusion algorithm[J]. Remote Sensing for Natural Resources, 2024, 36(2): 39-49.
[9] SONG Yingxu, ZOU Yujia, YE Runqing, HE Zhixia, WANG Ningtao. Dynamic analysis of landslide hazards in the Three Gorges Reservoir area based on Google Earth Engine[J]. Remote Sensing for Natural Resources, 2024, 36(1): 154-161.
[10] MING Xiaoyong, TIAN Yichao, ZHANG Qiang, TAO Jin, ZHANG Yali, LIN Junliang. Monitoring and analyzing land subsidence in Qinfang, Guangxi based on Sentinel-1A data[J]. Remote Sensing for Natural Resources, 2024, 36(1): 35-48.
[11] WANG Yumiao, LI Sheng, DONG Chunyu, YANG Gang. Remote sensing information extraction for mangrove forests based on multi-feature parameters: A case study of Guangdong Province[J]. Remote Sensing for Natural Resources, 2024, 36(1): 95-102.
[12] LI Guangzhe, WANG Hao, CAO Yinxuan, ZHANG Xiaoyu, NING Xiaogang. Spatio-temporal evolution and influencing factors of ecological environment quality in the Changsha-Zhuzhou-Xiangtan urban agglomeration[J]. Remote Sensing for Natural Resources, 2023, 35(4): 244-254.
[13] CHEN Jian, LI Hu, LIU Yufeng, CHANG Zhu, HAN Weijie, LIU Saisai. Crops identification based on Sentinel-2 data with multi-feature optimization[J]. Remote Sensing for Natural Resources, 2023, 35(4): 292-300.
[14] YU Sen, JIA Mingming, CHEN Gao, LU Yingying, LI Yi, ZHANG Bochun, LU Chunyan, LI Huiying. A study of the disturbance to mangrove forests in Dongzhaigang, Hainan based on LandTrendr[J]. Remote Sensing for Natural Resources, 2023, 35(2): 42-49.
[15] ZHU Lin, HUANG Yuling, YANG Gang, SUN Weiwei, CHEN Chao, HUANG Ke. Information extraction and spatio-temporal evolution analysis of the coastline in Hangzhou Bay based on Google Earth Engine and remote sensing technology[J]. Remote Sensing for Natural Resources, 2023, 35(2): 50-60.
Viewed
Full text


Abstract

Cited

  Shared   
  Discussed   
京ICP备05055290号-2
Copyright © 2017 Remote Sensing for Natural Resources
Support by Beijing Magtech