|
|
 |
|

|
|
|
A mapping methodology for wetland categories of the Yellow River Delta based on optimal feature selection and spatio-temporal fusion algorithm |
FENG Qian1( ), ZHANG Jiahua2,3(), DENG Fan1, WU Zhenjiang3, ZHAO Enling1, ZHENG Peixin1, HAN Yang1 ), ZHANG Jiahua2,3(), DENG Fan1, WU Zhenjiang3, ZHAO Enling1, ZHENG Peixin1, HAN Yang1 |
1. School of Geosciences, Yangtze University, Wuhan 430100, China
2. CAS Key Laboratory of Digital Earth Science, Aerospace Information Research Institute, Chinese Academy of Sciences, Beijing 100094, China
3. College of Earth and Planetary Sciences, University of Chinese Academy of Sciences, Beijing 100049, China |
|
|
|
|
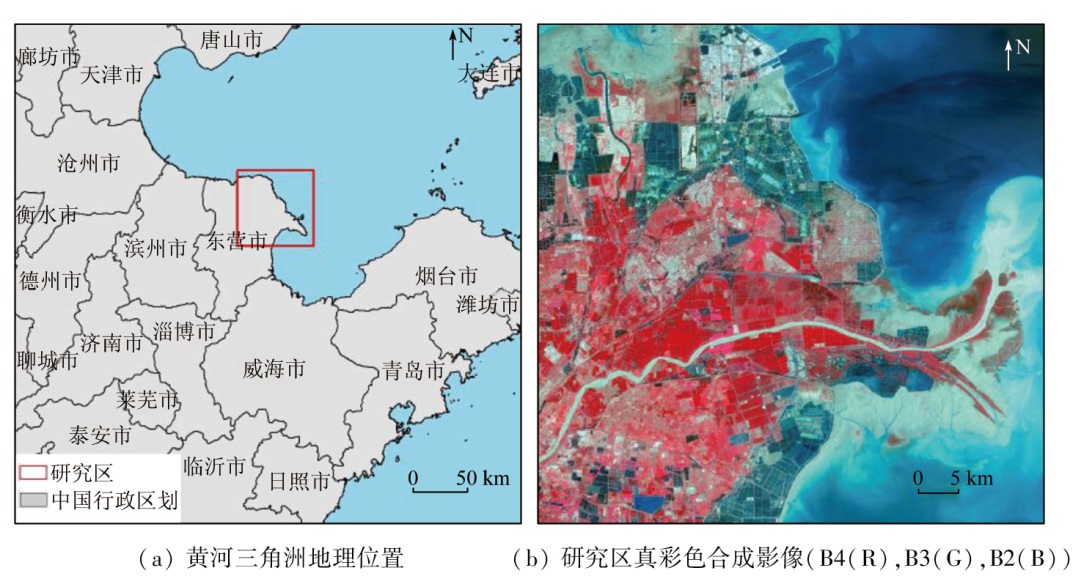
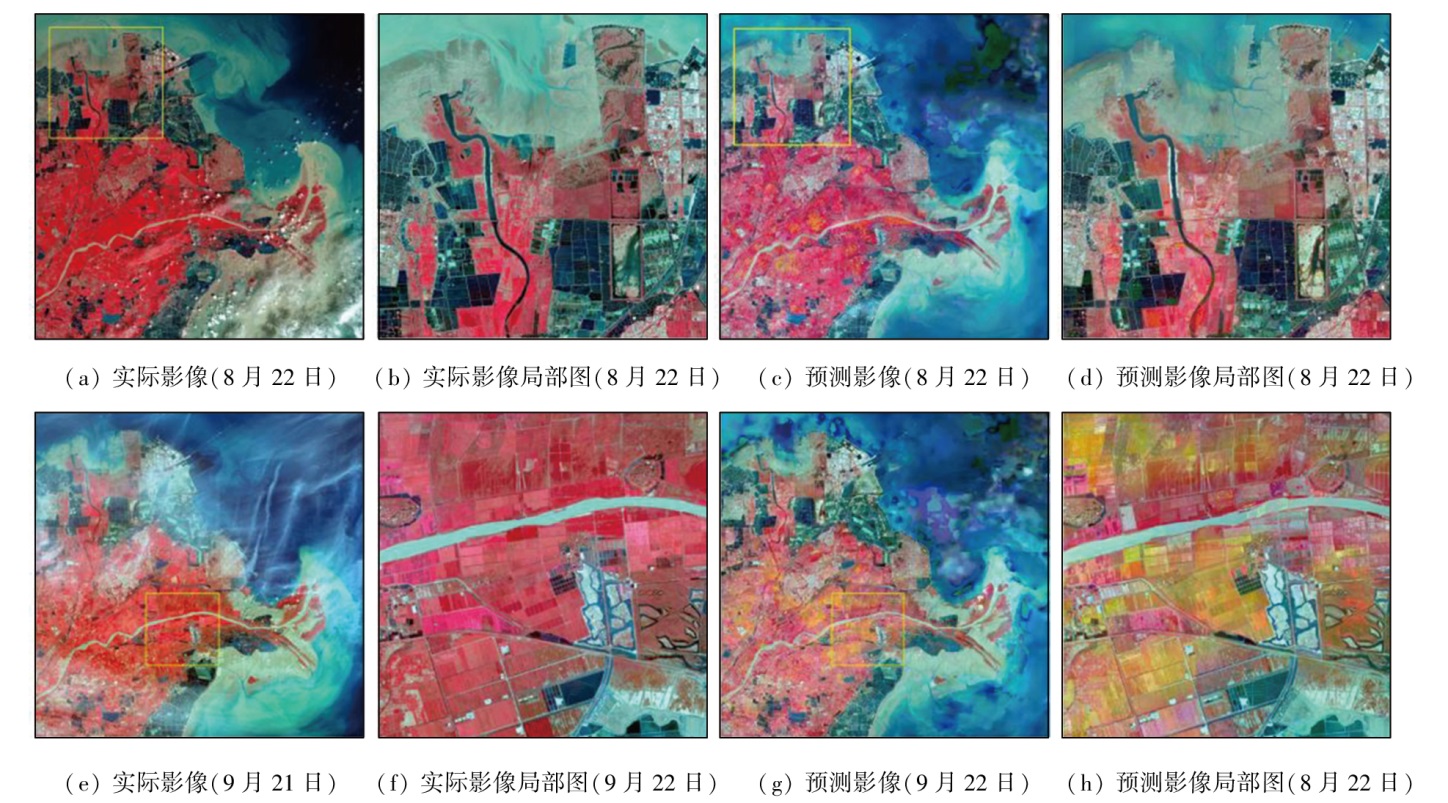
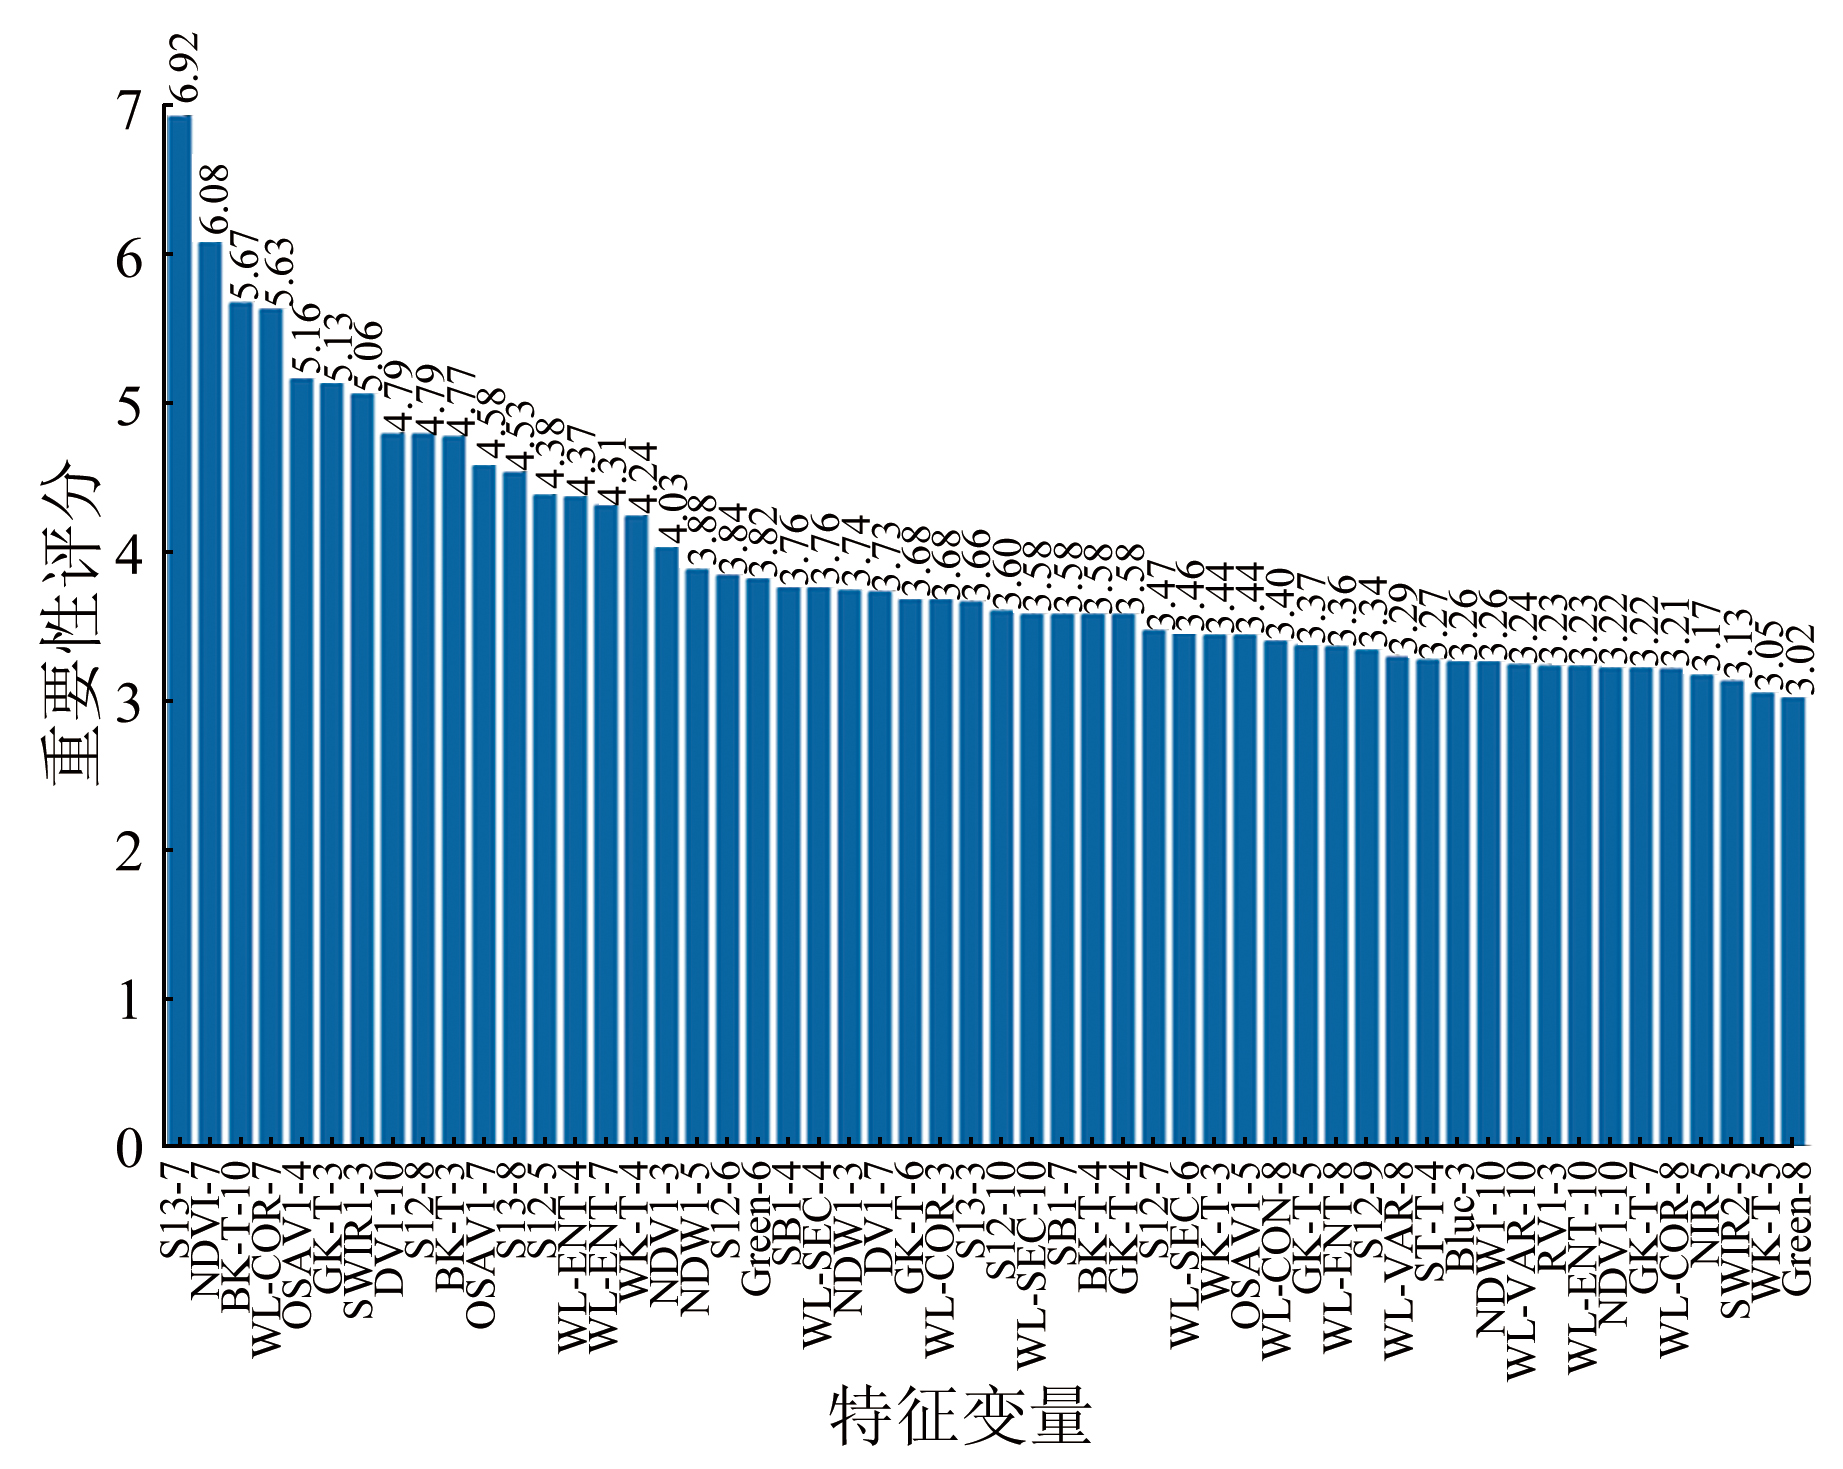
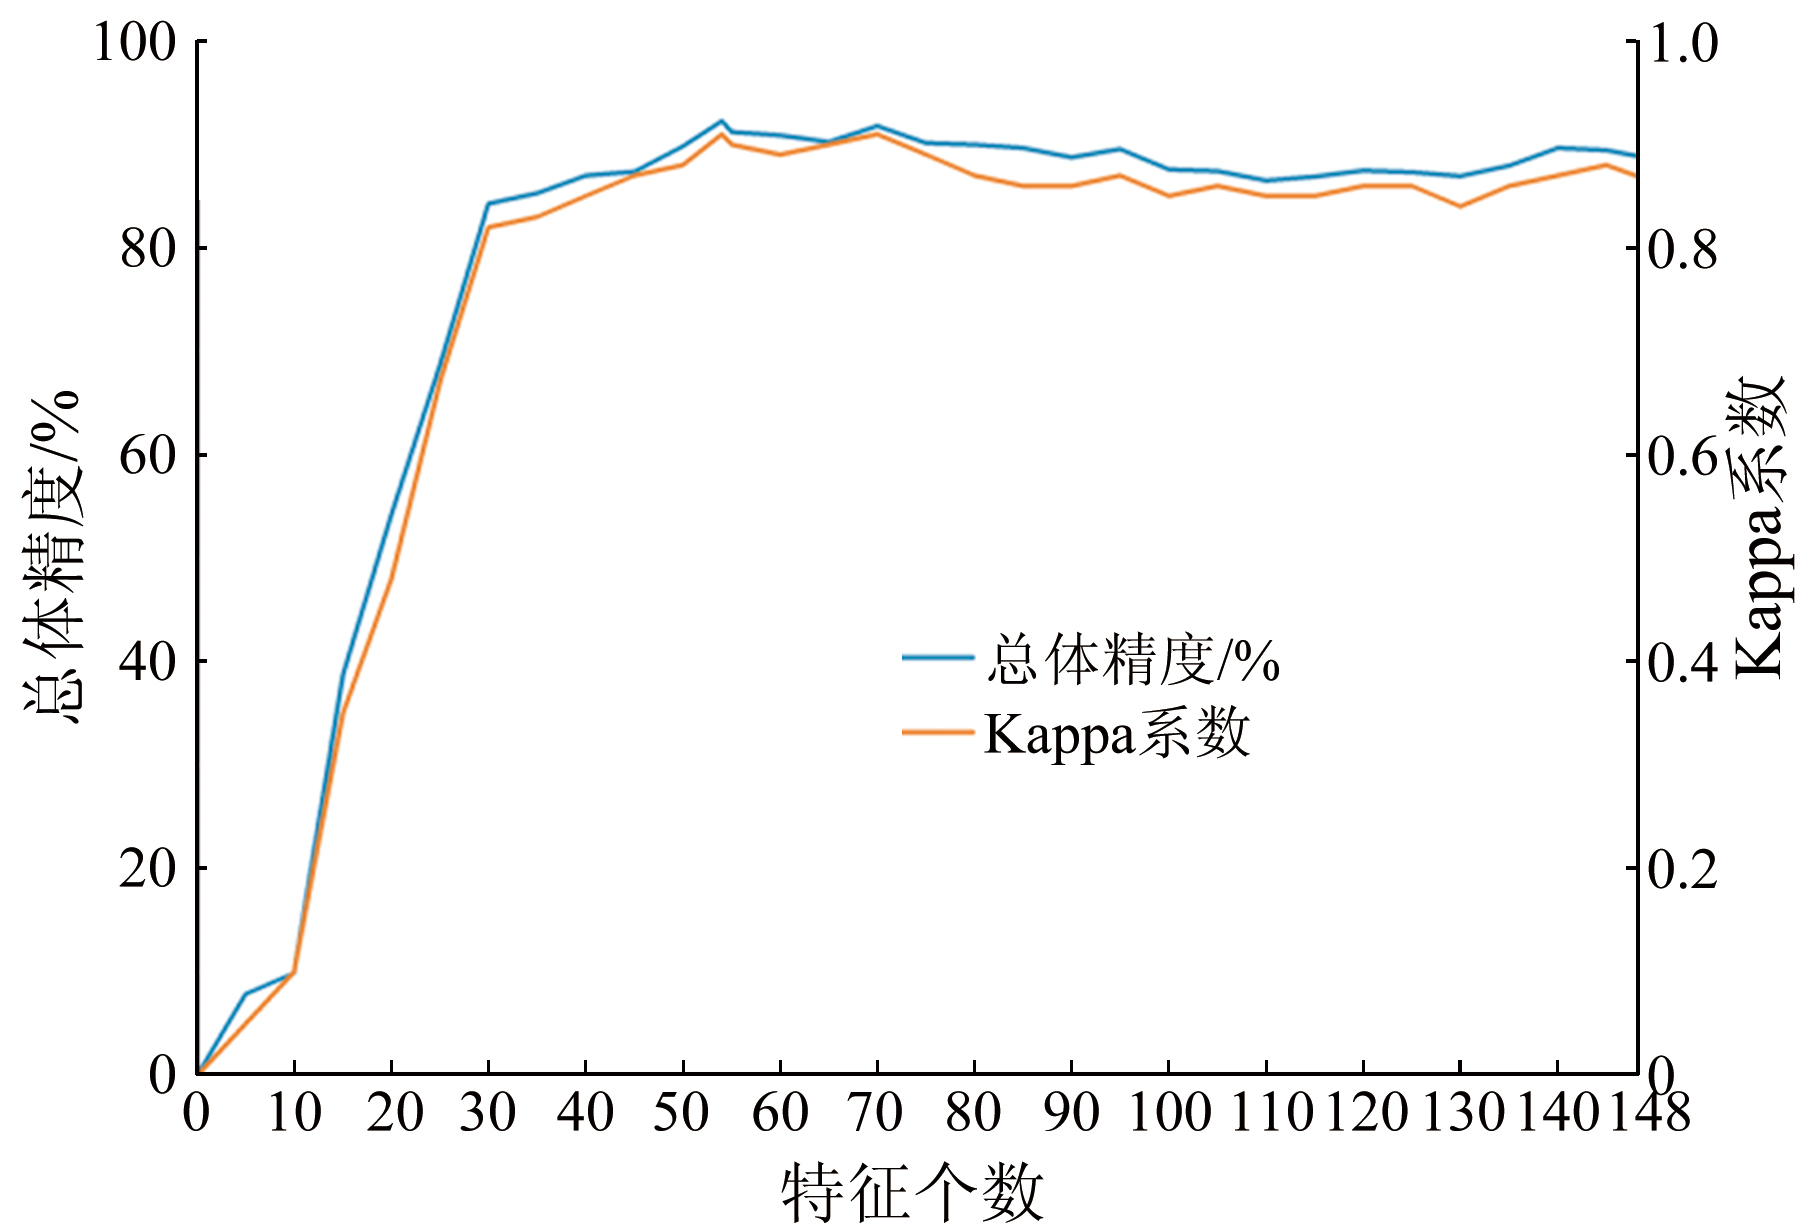
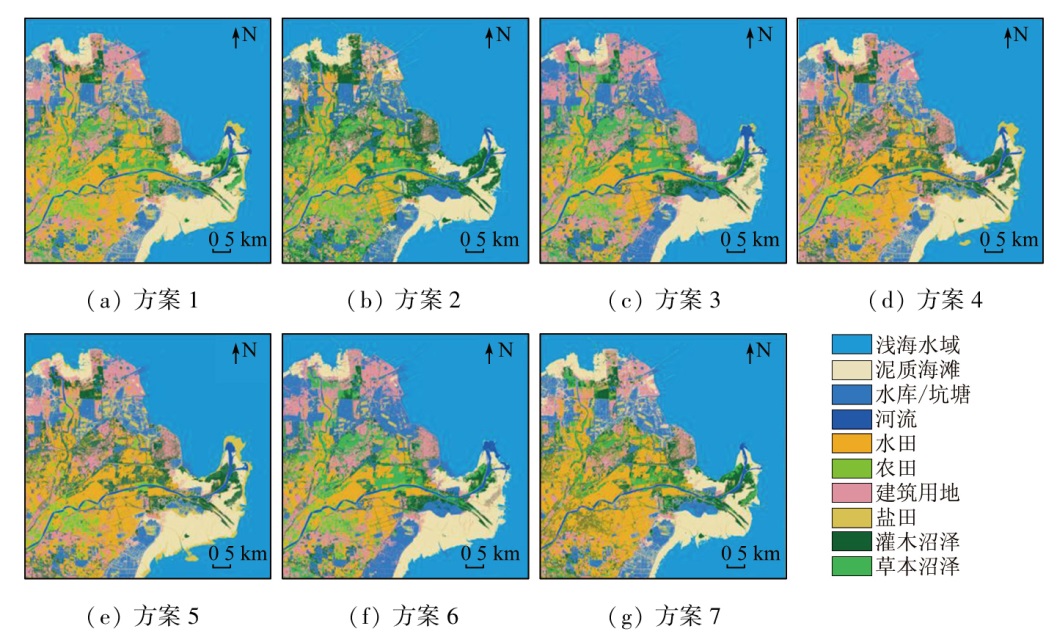
Abstract Exploring the remote sensing-based classification of coastal wetlands is significant for their conservation and planning. Hence, this study investigated the Yellow River Delta with the 8-view Landsat8 OIL images from March to October 2019 as the data source. It constructed seven classification schemes based on different features of the images on the Google Earth Engine (GEE) cloud platform. Then, it employed the random forest classifier to classify different feature sets, with the scheme exhibiting the best classification effects selected for mapping the wetland categories of the Yellow River Delta. Considering poor data quality in August and September due to cloud contamination, this study filled in the cloudy zones using the enhanced spatial and temporal adaptive reflectance fusion model (ESTARFM) algorithm. The results show that: ① The predicted images generated from the ESTARFM manifested a high correlation with the real image bands, with R values above 0.73, suggesting that the reconstructed images could be used in this study; ② The random forest algorithm was used to classify the surface feature types in the study area. Through optimal feature selection, the classification results of Scheme 7 demonstrated an overall accuracy of 92.28%, higher than those of conventional schemes, with a Kappa coefficient of 0.91, aligning with the actual wetland conditions. The results of this study can assist in deeply understanding the spatial distributions of different wetlands in the area, and provide a scientific basis for the conservation and planning of the regional ecological environment.
|
| Keywords
Landsat8
multitemporal data
Yellow River Delta wetland
image fusion
Google Earth Engine
random forest
|
|
|
|
Issue Date: 14 June 2024
|
|
|
| [1] |
张晓龙, 李培英, 李萍, 等. 中国滨海湿地研究现状与展望[J]. 海洋科学进展, 2005, 23(1):87-95.
|
| [1] |
Zhang X L, Li P Y, Li P, et al. Present conditions and prospects of Study on coastal wetlands in China[J]. Advances in Marine Science, 2005, 23(1):87-95.
|
| [2] |
刘润红, 梁士楚, 赵红艳, 等. 中国滨海湿地遥感研究进展[J]. 遥感技术与应用, 2017, 32(6):998-1011.
|
| [2] |
Liu R H, Liang S C, Zhao H Y, et al. Progress of Chinese coastal wetland based on remote sensing[J]. Remote Sensing Technology and Application, 2017, 32(6):998-1011.
|
| [3] |
朱纹君, 韩美, 魏丹妮, 等. 黄河三角洲人地关系协调度时空演变及其驱动机制[J]. 水土保持研究, 2023, 30(1):388-396.
|
| [3] |
Zhu W J, Han M, Wei D N, et al. Spatiotemporal evolution and driving mechanism of human-environment coordination in the Yellow River Delta[J]. Research of Soil and Water Conservation, 2023, 30(1):388-396.
|
| [4] |
刘海红, 刘胤序, 张春华, 等. 1991—2016年黄河三角洲湿地变化的遥感监测[J]. 地球与环境, 2018, 46(6):590-598.
|
| [4] |
Liu H H, Liu Y X, Zhang C H, et al. Remote sensing monitoring of wetland changes in the Yellow River Delta during 1991-2016[J]. Earth and Environment, 2018, 46(6):590-598.
|
| [5] |
钟燕飞, 吴浩, 刘寅贺. 湿地遥感制图研究现状与展望[J]. 中国科学基金, 2022, 36(3):420-431.
|
| [5] |
Zhong Y F, Wu H, Liu Y H. Research status and prospects of remote sensing for wetland mapping[J]. Bulletin of National Natural Science Foundation of China, 2022, 36(3):420-431.
|
| [6] |
祁欣. 基于机器学习的遥感数据处理方法综述[J]. 品牌与标准化, 2022(s1):148-150.
|
| [6] |
Qi Y. Survey of Remote sensing data processing methods based on machine learning[J]. Brand & Standardization, 2022(s1):148-150.
|
| [7] |
刘春亭, 冯权泷, 金鼎坚, 等. 随机森林协同Sentinel-1/2的东营市不透水层信息提取[J]. 自然资源遥感, 2021, 33(3):253-261.doi:10.6046/zrzyyg.2020310.
|
| [7] |
Liu C T, Feng Q L, Jin D J, et al. Application of random forest and Sentinel-1/2 in the information extraction of impervious layers in Dongying City[J]. Remote Sensing for Natural Resources, 2021, 33(3):253-261.doi:10.6046/zrzyyg.2020310.
|
| [8] |
黄佩, 普军伟, 赵巧巧, 等. 植被遥感信息提取方法研究进展及发展趋势[J]. 自然资源遥感, 2022, 34(2):10-19.doi:10.6046/zrzyyg.2021137.
|
| [8] |
Huang P, Pu J W, Zhao Q Q, et al. Research progress and development trend of remote sensing information extraction methods of vegetation[J]. Remote Sensing for Natural Resources, 2022, 34(2):10-19.doi:10.6046/zrzyyg.2021137.
|
| [9] |
Wu Z J, Zhang J H, Deng F, et al. Fusion of GF and MODIS data for regional-scale grassland community classification with EVI2 time-series and phenological features[J]. Remote Sensing, 2021, 13(5):835.
|
| [10] |
史飞飞, 高小红, 肖建设, 等. 基于集成学习和多时相遥感影像的枸杞种植区分类[J]. 自然资源遥感, 2022, 34(1):115-126.doi:10.6046/zrzyyg.2021064.
|
| [10] |
Shi F F, Gao X H, Xiao J S, et al. Classification of wolfberry planting areas based on ensemble learning and multi-temporal remote sensing images[J]. Remote Sensing for Natural Resources, 2022, 34(1):115-126.doi:10.6046/zrzyyg.2021064.
|
| [11] |
程筱茜, 洪友堂, 陈劲松, 等. 基于ESTARFM的内陆湖泊遥感动态变化监测[J]. 国土资源遥感, 2020, 32(3):183-190.doi:10.6064/zrzyyg.2020.03.24.
|
| [11] |
Cheng X Q, Hong Y T, Chen J S, et al. A study of the long-term remote sensing dynamic monitoring of inland based on ESTARFM[J]. Remote Sensing for Land and Resources, 2020, 32(3):183-190.doi:10.6064/zrzyyg.2020.03.24.
|
| [12] |
Gao F, Masek J, Schwaller M, et al. On the blending of the Landsat and MODIS surface reflectance: Predicting daily Landsat surface reflectance[J]. IEEE Transactions on Geoscience and Remote sensing, 2006, 44(8):2207-2218.
|
| [13] |
Zhu X L, Chen J, Gao F, et al. An enhanced spatial and temporal adaptive reflectance fusion model for complex heterogeneous regions[J]. Remote Sensing of Environment, 2010, 114(11):2610-2623.
|
| [14] |
高瑞, 王志勇, 周晓东, 等. 利用多时相遥感监测与分析黄河三角洲湿地变化动态[J]. 测绘通报, 2021(4):22-27.
doi: 10.13474/j.cnki.11-2246.2021.0105
|
| [14] |
Gao R, Wang Z Y, Zhou X D, et al. Monitoring and analysis of wetland change dynamics in the Yellow River Delta using multi-temporal remote sensing[J]. Bulletin of Surveying and Mapping, 2021(4):22-27.
doi: 10.13474/j.cnki.11-2246.2021.0105
|
| [15] |
程丽娜, 钟才荣, 李晓燕, 等. Sentinel-2密集时间序列数据和Google Earth Engine的潮间带湿地快速自动分类[J]. 遥感学报, 2022, 26(2):348-357.
|
| [15] |
Cheng L N, Zhong C R, Li Xiao Yan, et al. Rapid and automatic classification of intertidal wetlands based on intensive time series Sentinel-2 images and Google Earth Engine[J]. National Remote Sensing Bulletin, 2022, 26(2):348-357.
|
| [16] |
张磊, 宫兆宁, 王启为, 等. Sentinel-2影像多特征优选的黄河三角洲湿地信息提取[J]. 遥感学报, 2019, 23(2):313-326.
|
| [16] |
Zhang L, Gong Z N, Wang Q W, et al. Wetland mapping of Yellow River Delta wetlands based on multi-feature optimization of Sentinel-2 images[J]. National Remote Sensing Bulletin, 2019, 23(2):313-326.
|
| [17] |
杨迎港, 刘培, 张合兵, 等. 基于特征优选随机森林算法的GF-2影像分类[J]. 航天返回与遥感, 2022, 43(2):115-126.
|
| [17] |
Yang Y G, Liu P, Zhang H B, et al. Research on GF-2 image classification based on feature optimization random forest algorithm[J]. Spacecraft Recovery & Remote Sensing, 2022, 43(2):115-126.
|
| [18] |
朱琦, 郭华东, 张露. 基于多时相Landsat8 影像的海南岛热带天然林类型遥感分类[J]. 自然资源遥感, 2022, 34(2):215-223.doi:10.6046/zrzyyg.2021156.
|
| [18] |
Zhu Q, Guo H D, Zhang L, et al. Classification of tropical natural forests in Hainan Island based on multi-temporal Landsat8 remote sensing images[J]. Remote Sensing for Natural Resources, 2022, 34(2):215-223.doi:10.6046/zrzyyg.2021156.
|
| [19] |
Gorelick N, Hancher M, Dixon M, et al. Google Earth Engine: Planetary -scale geospatial analysis for everyone[J]. Remote Sensing of Environment, 2017, 202:18-27.
|
| [20] |
王渊, 赵宇豪, 吴健生. 基于Google Earth Engine云计算的城市群生态质量长时序动态监测——以粤港澳大湾区为例[J]. 生态学报, 2020, 40(23):8461-8473.
|
| [20] |
Wang Y, Zhao Y H, Wu J S. Dynamic monitoring of long time series of ecological quality in urban agglomerations using Google Earth Engine cloud computing:A case study of the Guang dong-Hong Kong-Macao Greater Bay Area,China[J]. Acta Ecologica Sinica, 2020, 40(23):8461-8473.
|
| [21] |
徐振田, 张莎, 白雲, 等. 基于 Landsat 数据的黄河三角洲湿地提取及近 30 年动态研究[J]. 海洋湖沼通报, 2020(3):70-79.
|
| [21] |
Xu Z T, Ail S, Zhang S, et al. Mapping the wetland in Yellow River Delta and its dynamics in recent 30 years based on Landsat data[J]. Transactions of Oceanology and Limnology, 2020(3):70-79.
|
| [22] |
牟晓杰, 刘兴土, 阎百兴, 等. 中国滨海湿地分类系统[J]. 湿地科学, 2015, 13(1):19-26.
|
| [22] |
Mou X J, Liu X T, Yan B X, et al. Classification system of coastal wetlands in China[J]. Wetland Science, 2015, 13(1):19-26.
|
| [23] |
Bradley A, Jackway P, Lovell B. Classification in scale-space:Applications to texture analysis[C]// Int.Conf.on Information Processing in Medical Imaging, 1995:375-376.
|
| [24] |
Breiman L. Random forests[J]. Machine Learning, 2001, 45(1):5-32.
|
|
Viewed |
|
|
|
Full text
|
|
|
|
|
Abstract
|
|
|
|
|
Cited |
|
|
|
|
| |
Shared |
|
|
|
|
| |
Discussed |
|
|
|
|
 2024,
Vol. 36
2024,
Vol. 36