|
|
 |
|

|
|
|
Exploring the ecological effects of land use changes in mining areas under different mining modes based on the Google Earth Engine |
LIN Xinyuan1( ), CHENG Yangjian1, XIE Wei2, LI Chuanqing3, NIE Wen2() ), CHENG Yangjian1, XIE Wei2, LI Chuanqing3, NIE Wen2() |
1. School of Advanced Manufacturing, Fuzhou University, Jinjiang 362200, China
2. Sinosteel Ma’anshan General Institute of Mining Research Co., Ltd., Ma’anshan 243000, China
3. School of Earth and Environment, Anhui University of Science and Technology, Huainan 232001, China |
|
|
|
|
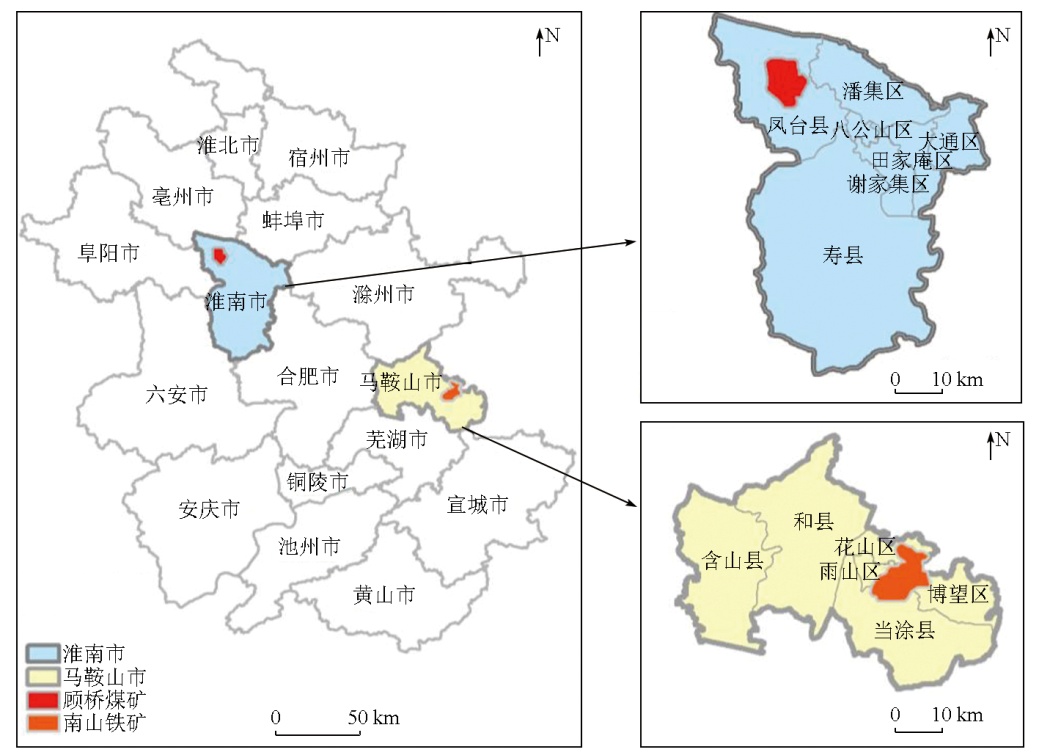
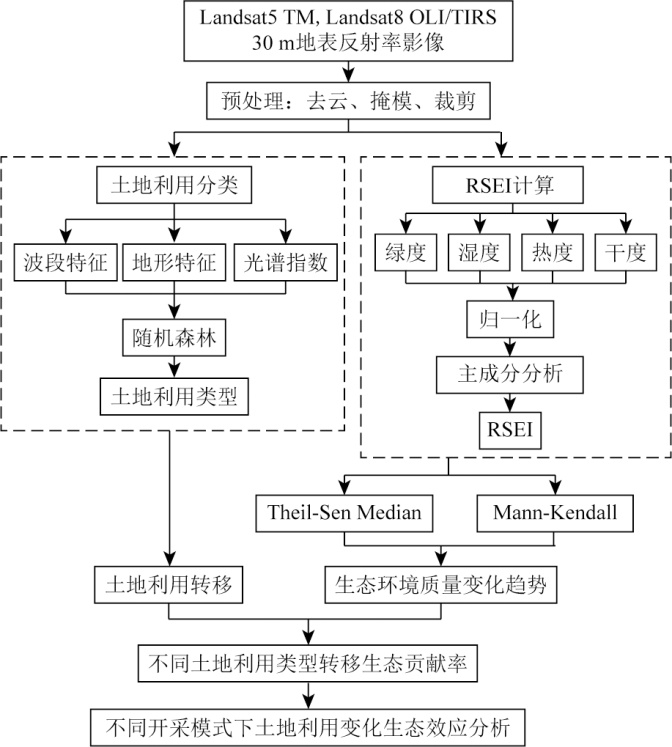
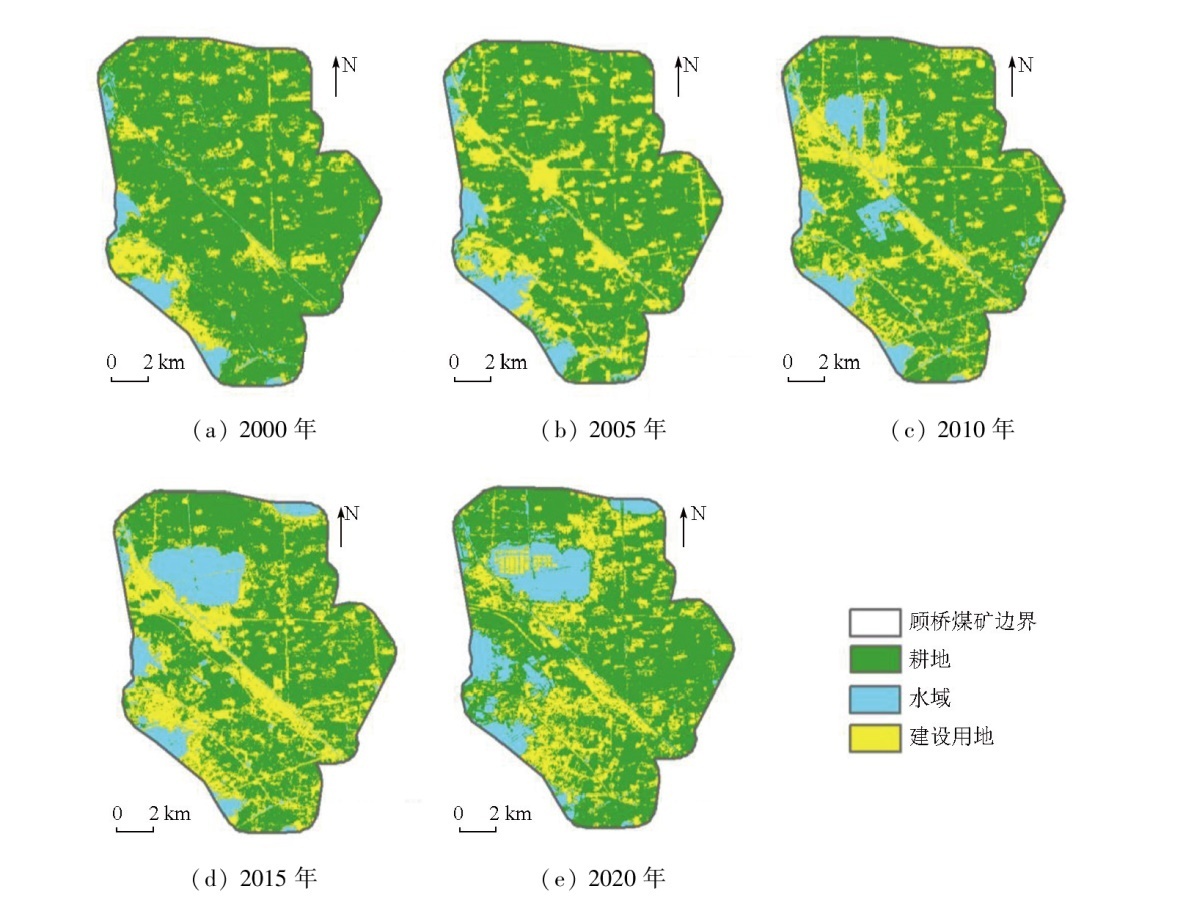
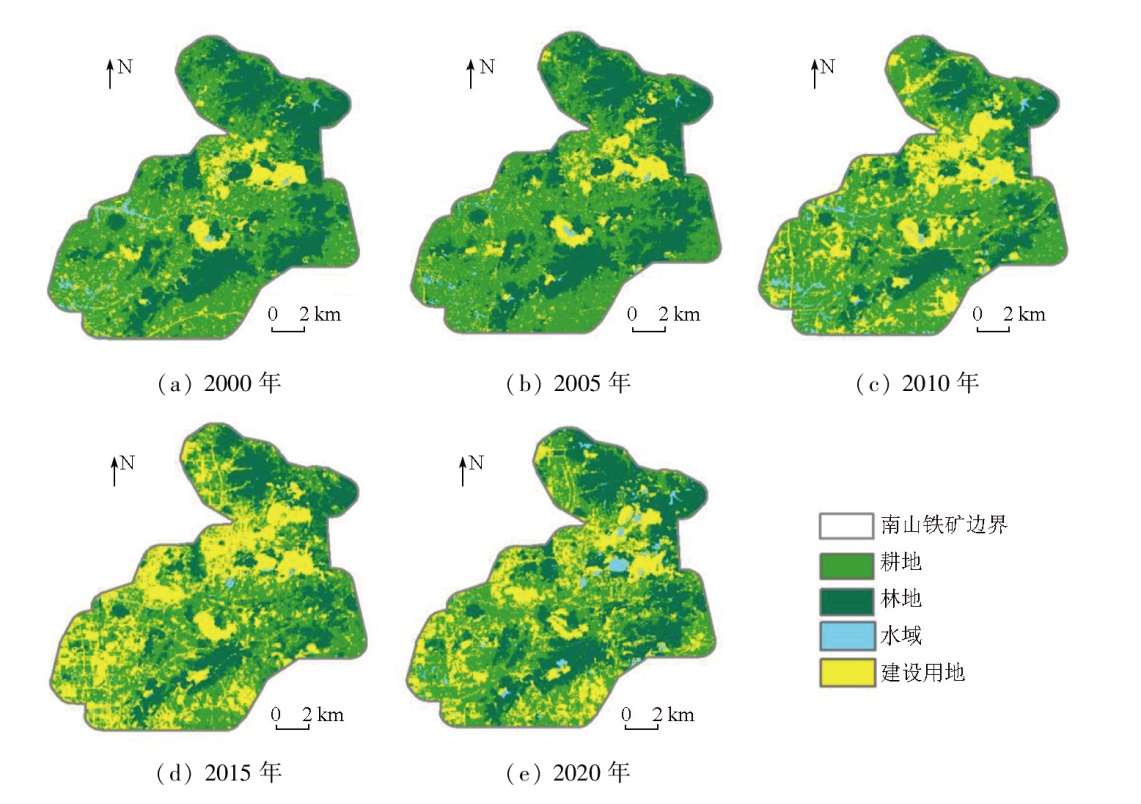
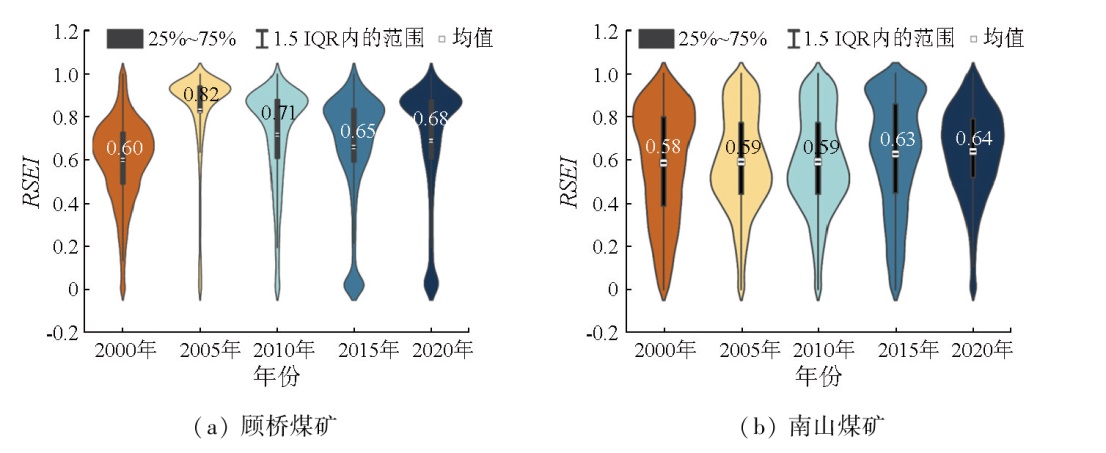
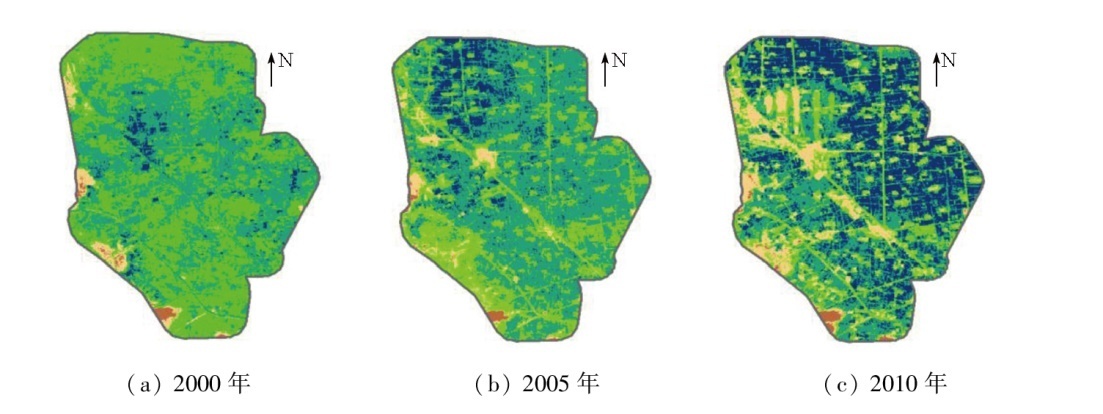
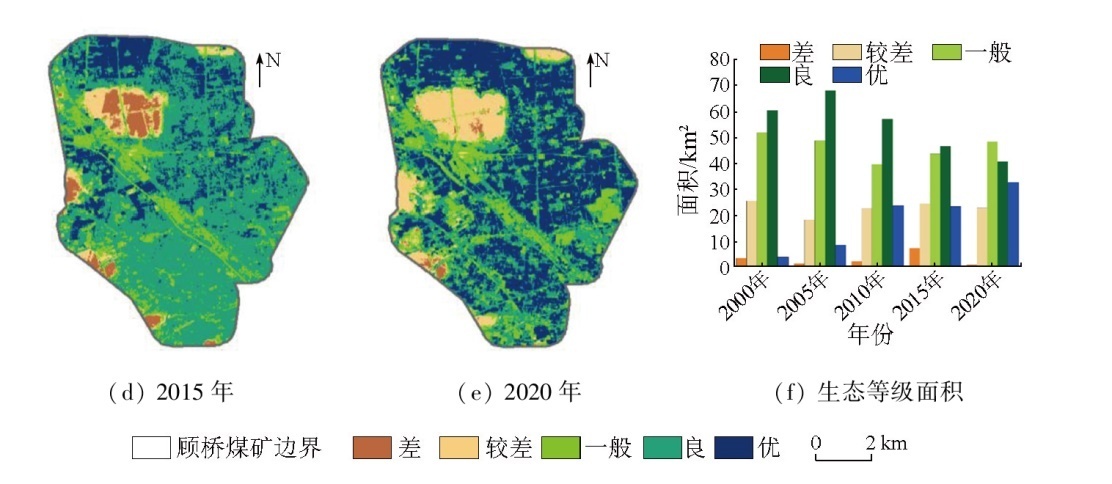
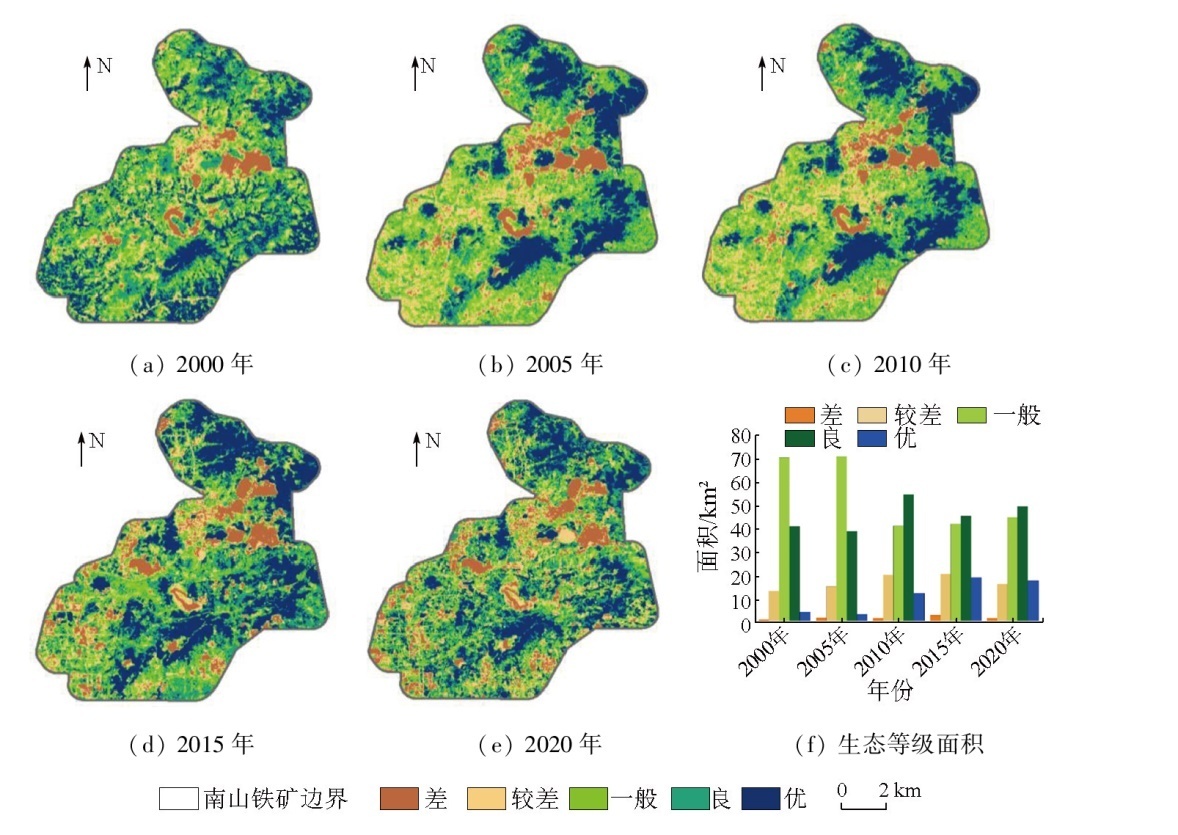
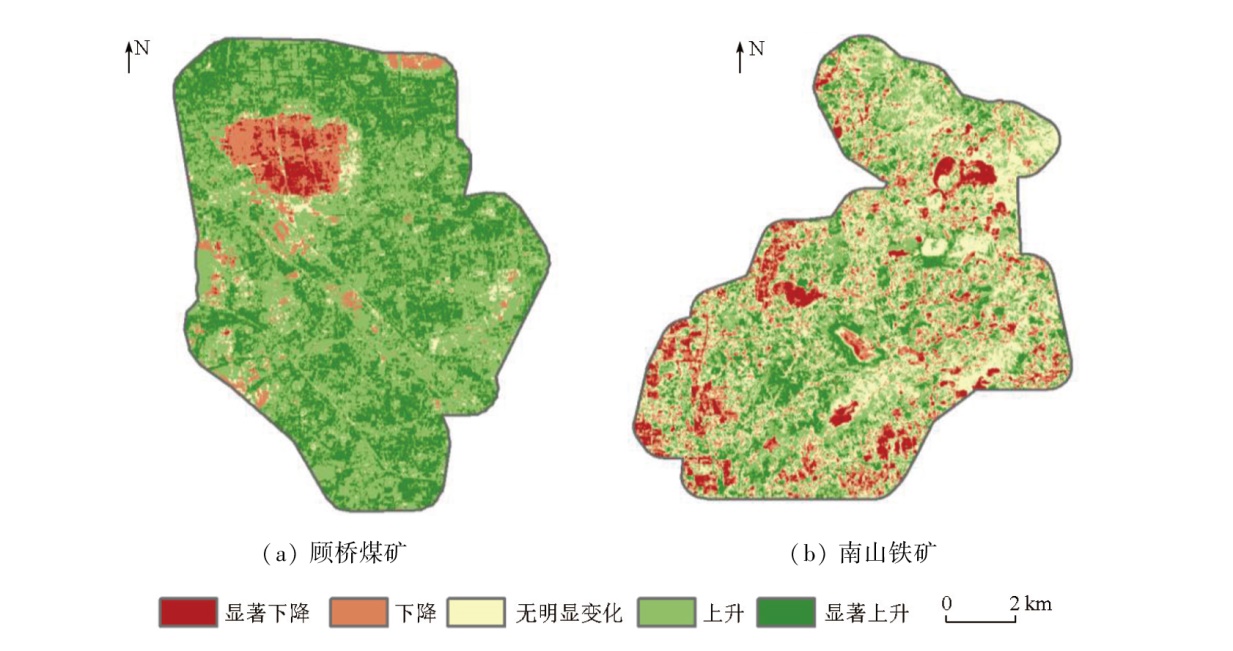
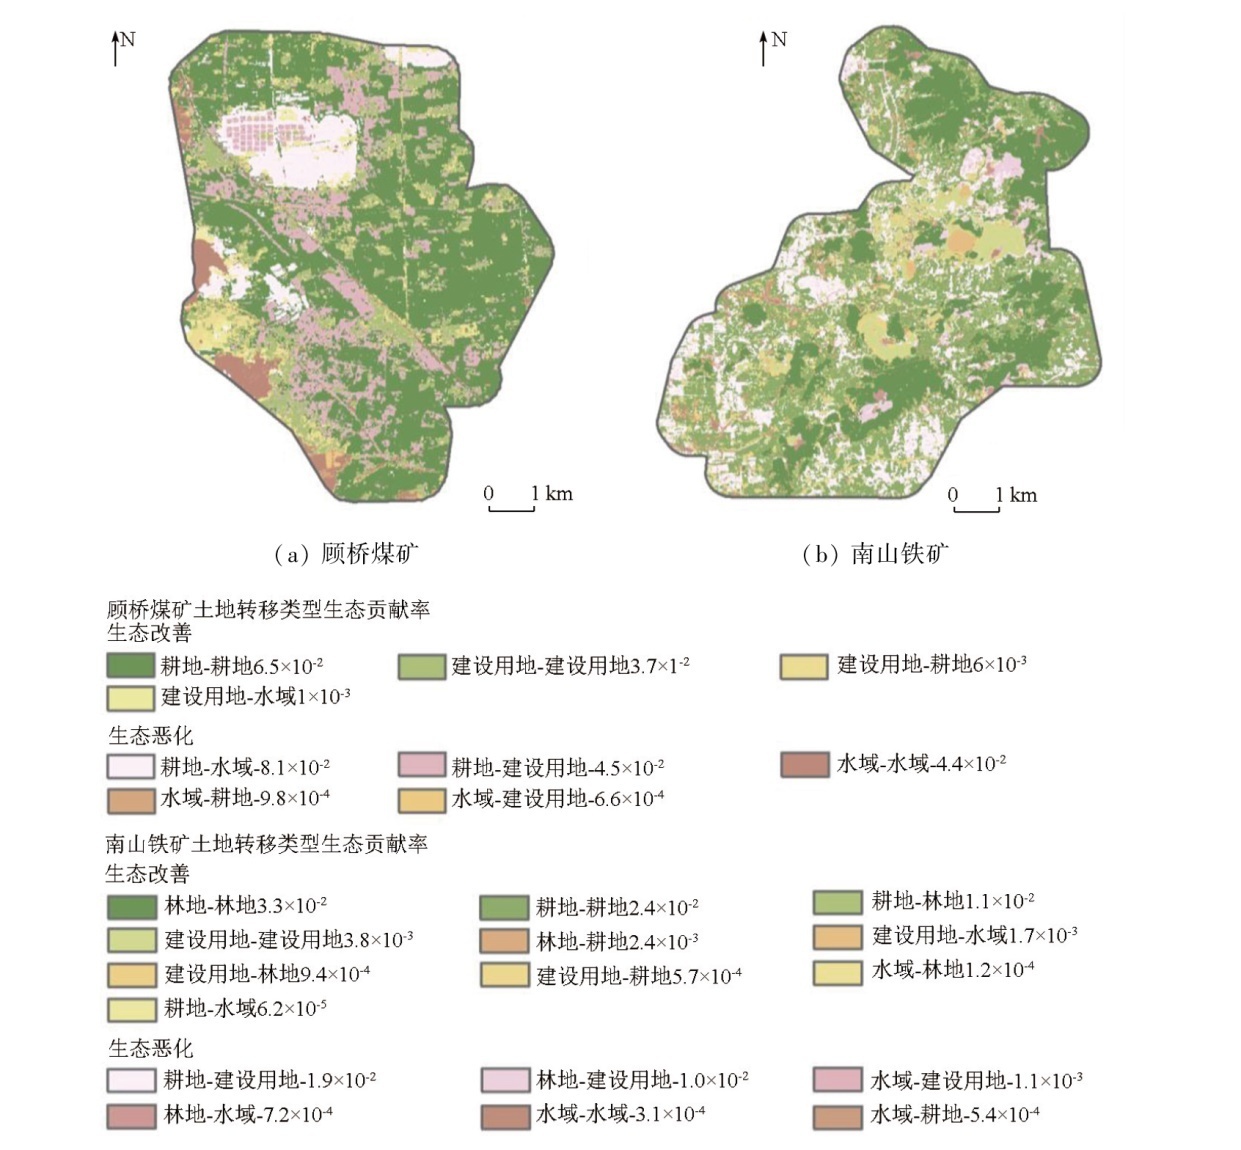
Abstract To investigate the ecological and environment effects of land-use changes under different mining modes, this study utilized the Google Earth Engine (GEE) cloud computing platform to construct a remote sensing ecological index (RSEI) by integrating the greenness, heat, dryness, and wetness indicators. The RSEI was utilized to assess the ecological quality of two mining areas with different mining modes: the Guqiao Coal Mine in Huainan City (underground mining) and the Nanshan Iron Mine in Ma’anshan City (open-pit mining). Through a comparative analysis of relevant data from 2000 to 2020, this study analyzed the dynamic evolutionary patterns between land use changes and ecological quality in the two mining areas. The results indicate that cultivated land occupied the largest proportion in both mining areas. The underground mining area was characterized by a significantly expanded water area, whereas the open-pit mining area featured reduced cultivated and forest lands and increased construction land. Both mining areas exhibited overall good-to-fair ecological quality. Specifically, the RSEI values for the Guqiao Coal Mine were 0.60, 0.82, 0.71, 0.65, and 0.68, while those for the Nanshan Iron Mine were 0.58, 0.59, 0.59, 0.63, and 0.64. Among various land use types, construction land and water bodies displayed relatively poor ecological conditions, whereas forest and cultivated lands exhibited more favorable conditions. The underground mining area showed surface subsidence and the transition of cultivated land to water areas, leading to deteriorating ecological quality. In contrast, the open-pit mining area showed soil stripping, shrinking forest and cultivated lands, and construction land expansion, contributing significantly to the declining ecological quality.
|
| Keywords
underground mining
open-pit mining
Google Earth Engine (GEE)
land use change
remote sensing ecological index (RSEI)
|
|
|
|
Issue Date: 01 July 2025
|
|
|
| [1] |
刘英, 许萍萍, 毕银丽, 等. 新疆戈壁煤矿露天开采对生态环境扰动定量分析[J]. 煤炭学报, 2023, 48(2):959-974.
|
| [1] |
Liu Y, Xu P P, Bi Y L, et al. Quantitative analysis of coal mining disturbance on environment in Xinjiang Gobi open-pit mining area[J]. Journal of China Coal Society, 2023, 48(2):959-974.
|
| [2] |
王晓辉, 耿宜佳. 淮南煤矿区土地利用变化分析[J]. 安徽农业科学, 2015, 43(36):295-298.
|
| [2] |
Wang X H, Geng Y J. Land use changes in Huainan coal mining area[J]. Journal of Anhui Agricultural Sciences, 2015, 43(36):295-298.
|
| [3] |
张敏. 大型露天煤矿区土地利用时空演变特征及生态影响研究[D]. 北京: 中国地质大学(北京), 2021.
|
| [3] |
Zhang M. Spatio-temporal evolution characteristics of land use change and ecological impact in a large opencast coal mine area[D]. Beijing: China University of Geosciences, 2021.
|
| [4] |
朱冬雨, 陈涛, 牛瑞卿, 等. 利用移动窗口遥感生态指数分析矿区生态环境[J]. 武汉大学学报(信息科学版), 2021, 46(3):341-347.
|
| [4] |
Zhu D Y, Chen T, Niu R Q, et al. Analyzing the ecological environment of mining area by using moving window remote sensing ecological index[J]. Geomatics and Information Science of Wuhan University, 2021, 46(3):341-347.
|
| [5] |
王双明, 杜华栋, 王生全. 神木北部采煤塌陷区土壤与植被损害过程及机理分析[J]. 煤炭学报, 2017, 42(1):17-26.
|
| [5] |
Wang S M, Du H D, Wang S Q. Analysis of damage process and mechanism for plant community and soil properties at northern Shenmu subsidence mining area[J]. Journal of China Coal Society, 2017, 42(1):17-26.
|
| [6] |
范立民, 向茂西, 彭捷, 等. 西部生态脆弱矿区地下水对高强度采煤的响应[J]. 煤炭学报, 2016, 41(11):2672-2678.
|
| [6] |
Fan L M, Xiang M X, Peng J, et al. Groundwater response to intensive mining in ecologically fragile area[J]. Journal of China Coal Society, 2016, 41(11):2672-2678.
|
| [7] |
汪云甲. 矿区生态扰动监测研究进展与展望[J]. 测绘学报, 2017, 46(10):1705-1716.
doi: 10.11947/j.AGCS.2017.20170358
|
| [7] |
Wang Y J. Research progress and prospect on ecological distur-bance monitoring in mining area[J]. ActaGeodaetica et Cartographica Sinica, 2017, 46(10):1705-1716.
|
| [8] |
徐涵秋. 城市遥感生态指数的创建及其应用[J]. 生态学报, 2013, 33(24):7853-7862.
|
| [8] |
Xu H Q. A remote sensing urban ecological index and its application[J]. ActaEcologica Sinica, 2013, 33(24):7853-7862.
|
| [9] |
Liu H, Jiang Y, Misa R, et al. Ecological environment changes of mining areas around Nansi Lake with remote sensing monitoring[J]. Environmental Science and Pollution Research International, 2021, 28(32):44152-44164.
|
| [10] |
Nie X, Hu Z, Zhu Q, et al. Research on temporal and spatial resolution and the driving forces of ecological environment quality in coal mining areas considering topographic correction[J]. Remote Sensing, 2021, 13(14):2815.
|
| [11] |
Tang H, Fang J, Xie R, et al. Impact of land cover change on a typical mining region and its ecological environment quality evaluation using remote sensing based ecological index (RSEI)[J]. Sustainability, 2022, 14(19):12694.
|
| [12] |
Breiman L. Randomforests[J]. Machine Learning, 2001, 45(1):5-32.
|
| [13] |
国家质量监督检验检疫总局, 中国国家标准化管理委员会. GB/T 21010—2017 土地利用现状分类[S]. 北京: 中国标准出版社, 2017.
|
| [13] |
General Administration of Quality Supervision,Inspection and Quarantine of the People’s Republic of China, Standardization Administration of the People’s Republic of China. GB/T 21010—2017 Current land use classification[S]. Beijing: Standards Press of China, 2017.
|
| [14] |
姚金玺, 王浪, 李建忠, 等. 青海诺木洪地区多源遥感及多特征组合地物分类[J]. 农业工程学报, 2022, 38(3):247-256.
|
| [14] |
Yao J X, Wang L, Li J Z, et al. Multi-source remote sensing and multi-feature combination ground object classification in Nuomuhongareas,Qinghai Province of China[J]. Transactions of the Chinese Society of Agricultural Engineering, 2022, 38(3):247-256.
|
| [15] |
Nichol J. Remote sensing of urban heat islands by day and night[J]. Photogrammetric Engineering & Remote Sensing, 2005, 71(5):613-621.
|
| [16] |
Crist E P. A TM Tasseled Cap equivalent transformation for reflectance factor data[J]. Remote Sensing of Environment, 1985, 17(3):301-306.
|
| [17] |
Baig M H A, Zhang L, Shuai T, et al. Derivation of a tasselled cap transformation based on Landsat8 at-satellite reflectance[J]. Remote Sensing Letters, 2014, 5(5):423-431.
|
| [18] |
Rikimaru A, Roy P S, Miyatake S. Tropical forest cover density mapping[J]. Tropical Ecology, 2002, 43(1):39-47.
|
| [19] |
Xu H. A new index for delineating built-up land features in satellite imagery[J]. International Journal of Remote Sensing, 2008, 29(14):4269-4276.
|
| [20] |
Sen P K. Estimates of the regression coefficient based on Kendall’s Tau[J]. Journal of the American Statistical Association, 1968, 63(324):1379-1389.
|
| [21] |
Kendall M G. Rank correlation methods[J]. The Economic Journal, 1948,59:575-577.
|
| [22] |
杨保华, 杨清华, 陈剑虹. 关于《生态环境状况评价技术规范(试行)》中土地退化指数的权重及计算方法的探讨[J]. 生态与农村环境学报, 2011, 27(3):103-107.
|
| [22] |
Yang B H, Yang Q H, Chen J H. Weight of land(soil) degradation indices and optimization of their calculation in “technical criteria for evaluation of ecological environment(trial)”[J]. Journal of Ecology and Rural Environment, 2011, 27(3):103-107.
|
| [23] |
黄望望, 姜春露, 陈星, 等. 淮南新集矿区主要充水含水层水化学特征及成因[J]. 地球与环境, 2020, 48(4):432-442.
|
| [23] |
Huang W W, Jiang C L, ChenX, et al. Chemical characteristics and genesis of deep groundwater in the Xinji mining area[J]. Earth and Environment, 2020, 48(4):432-442.
|
| [24] |
何庆. 露天煤矿复垦区生态系统服务功能评价与权衡研究[D]. 杨凌: 西北农林科技大学, 2023.
|
| [24] |
He Q. The evaluation of ecosystem service function and its trade-off in reclamation area of opencast coal mine[D]. Yangling: Northwest A & F University, 2023.
|
| [25] |
李晓文, 方创琳, 黄金川, 等. 西北干旱区城市土地利用变化及其区域生态环境效应——以甘肃河西地区为例[J]. 第四纪研究, 2003, 23(3):280-290,348-349.
|
| [25] |
Li X W, Fang C L, Huang J C, et al. The urban land use transformations and associated effects on eco-environment in Northwest China arid region:A case study in HexiRegion,Gansu Province[J]. Quaternary Sciences, 2003, 23(3):280-290,348-349.
|
| [26] |
宗慧琳, 张晓伦, 袁希平, 等. 利用GEE进行1990—2022年小江流域生态环境质量时空格局与演变趋势分析[J]. 环境科学, 2024, 45(7):4122-4136.
|
| [26] |
Zong H L, Zhang X L, Yuan X P, et al. Xiaojiang river basin ecological environmental quality spatiotemporal pattern and evolutionary trend analysis using GEE from 1990 to 2022[J]. Environmental Science, 2024, 45(7):4122-4136.
|
| [27] |
雷少刚, 卞正富. 西部干旱区煤炭开采环境影响研究[J]. 生态学报, 2014, 34(11):2837-2843.
|
| [27] |
Lei S G, Bian Z F. Research progress on the environment impacts from underground coal mining in arid western area of China[J]. ActaEcologica Sinica, 2014, 34(11):2837-2843.
|
| [28] |
刘硕, 李小光, 宋建伟, 等. 长山沟露天矿集中区土地利用时空变化的遥感监测与分析[J]. 水土保持通报, 2021, 41(4):121-127,2.
|
| [28] |
Liu S, Li X G, Song J W, et al. Remote sensing monitoring and analysis of spatiotemporal changes in Changshangou open pit mine concentration area[J]. Bulletin of Soil and Water Conservation, 2021, 41(4):121-127,2.
|
|
Viewed |
|
|
|
Full text
|
|
|
|
|
Abstract
|
|
|
|
|
Cited |
|
|
|
|
| |
Shared |
|
|
|
|
| |
Discussed |
|
|
|
|
 2025,
Vol. 37
2025,
Vol. 37